Exam 12: Chi-Square and Nonparametric Tests
Exam 1: Defining and Collecting Data207 Questions
Exam 2: Organizing and Visualizing Variables213 Questions
Exam 3: Numerical Descriptive Measures167 Questions
Exam 4: Basic Probability171 Questions
Exam 5: Discrete Probability Distributions217 Questions
Exam 6: The Normal Distributions and Other Continuous Distributions189 Questions
Exam 7: Sampling Distributions135 Questions
Exam 8: Confidence Interval Estimation189 Questions
Exam 9: Fundamentals of Hypothesis Testing: One-Sample Tests187 Questions
Exam 10: Two-Sample Tests208 Questions
Exam 11: Analysis of Variance216 Questions
Exam 12: Chi-Square and Nonparametric Tests178 Questions
Exam 13: Simple Linear Regression214 Questions
Exam 14: Introduction to Multiple Regression336 Questions
Exam 15: Multiple Regression Model Building99 Questions
Exam 16: Time-Series Forecasting173 Questions
Exam 17: Business Analytics115 Questions
Exam 18: A Roadmap for Analyzing Data329 Questions
Exam 19: Statistical Applications in Quality Management Online162 Questions
Exam 20: Decision Making Online129 Questions
Exam 21: Understanding Statistics: Descriptive and Inferential Techniques39 Questions
Select questions type
SCENARIO 12-2 The dean of a college is interested in the proportion of graduates from his college who have a job offer on graduation day.He is particularly interested in seeing if there is a difference in this proportion for accounting and economics majors.In a random sample of 100 of each type of major at graduation, he found that 65 accounting majors and 52 economics majors had job offers. If the accounting majors are designated as "Group 1" and the economics majors are designated as "Group 2," perform the appropriate hypothesis test using a level of significance of 0.05.
-Referring to Scenario 12-2, the same decision would be made with this test if the level of significance had been 0.10 rather than 0.05.
(True/False)
4.9/5  (36)
(36)
SCENARIO 12-15 Two new different models of compact SUVs have just arrived at the market.You are interested in comparing the gas mileage performance of both models to see if they are the same.A partial computer output for twelve compact SUVs of model 1 and thirteen of model 2 is given below: 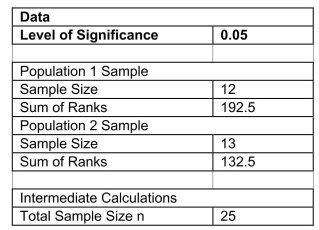 You are told that the gas mileage population distributions for both models are not normally distributed.
-Referring to Scenario 12-15, what is(are)the critical value(s)using a 5% level of significance?
You are told that the gas mileage population distributions for both models are not normally distributed.
-Referring to Scenario 12-15, what is(are)the critical value(s)using a 5% level of significance?
(Short Answer)
4.9/5 (36)
SCENARIO 12-16 As part of an evaluation program, a sporting goods retailer wanted to compare the downhill coasting speeds of 4 brands of bicycles.She took 3 of each brand and determined their maximum downhill speeds.The results are presented in miles per hour in the table below. 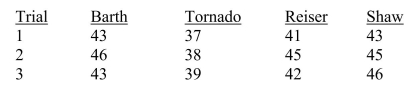 -Referring to Scenario 12-16, the sporting goods retailer decided to perform a Kruskal- Wallis test even though the sample size in each of the 4 groups is not larger than 5.The null hypothesis of the test is ________.
(Short Answer)
4.8/5 (33)
SCENARIO 12-17 Three new different models of compact SUVs have just arrived at the market.You are interested in comparing the gas mileage performance of all three models to see if they are the same.A partial computer output for twelve compact SUVs of each model is given below: 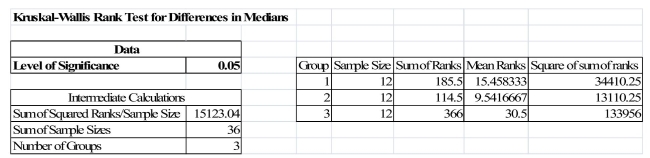 You are told that the gas mileage population distributions for all three models are not normally distributed.
-Referring to Scenario 12-17, what should be the null and alternative hypotheses of the test?
You are told that the gas mileage population distributions for all three models are not normally distributed.
-Referring to Scenario 12-17, what should be the null and alternative hypotheses of the test?
(Multiple Choice)
4.8/5 (36)
SCENARIO 12-5 Four surgical procedures currently are used to install pacemakers.If the patient does not need to return for follow-up surgery, the operation is called a "clear" operation.A heart center wants to compare the proportion of clear operations for the 4 procedures, and collects the following numbers of patients from their own records: 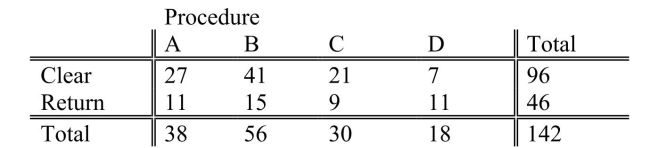 They will use this information to test for a difference among the proportion of clear operations using a chi-square test with a level of significance of 0.05.
-Referring to Scenario 12-5, what is the value of the critical range for the Marascuilo procedure to test for the difference in proportions between procedure A and procedure D using a 0.05 level of significance?
They will use this information to test for a difference among the proportion of clear operations using a chi-square test with a level of significance of 0.05.
-Referring to Scenario 12-5, what is the value of the critical range for the Marascuilo procedure to test for the difference in proportions between procedure A and procedure D using a 0.05 level of significance?
(Short Answer)
4.8/5 (37)
SCENARIO 12-12 Parents complain that children read too few storybooks and watch too much television nowadays.A survey of 1,000 children reveals the following information on average time spent watching TV and average time spent reading storybooks 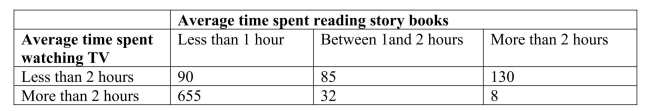 -Referring to Scenario 12-12, if the null hypothesis of no connection between time spent watching TV and time spent reading story books is true, how many children watching less than 2 hours of TV and reading more than 2 hours of story books on average can we expect?
(Multiple Choice)
4.8/5 (38)
SCENARIO 12-8 A study was conducted to determine whether the use of seat belts in motor vehicles depends on the educational status of the parents.A sample of 792 children treated for injuries sustained from motor vehicle accidents was obtained, and each child was classified according to (1)parents' educational status (College Degree or Non-College Degree)and (2)seat belt usage (worn or not worn)during the accident.The number of children in each category is given in the table below. 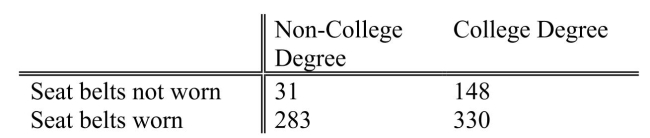 -Referring to Scenario 12-8, at 5% level of significance, there is sufficient evidence to conclude that
(Multiple Choice)
5.0/5 (39)
SCENARIO 12-4 A computer used by a 24-hour banking service is supposed to randomly assign each transaction to one of 5 memory locations.A check at the end of a day's transactions gave the counts shown in the table to each of the 5 memory locations, along with the number of reported errors. 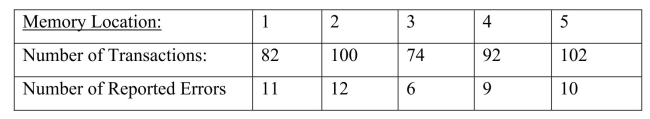 The bank manager wanted to test whether the proportion of errors in transactions assigned to each of the 5 memory locations differ.
-Referring to Scenario 12-4, which test would be used to properly analyze the data in this experiment?
The bank manager wanted to test whether the proportion of errors in transactions assigned to each of the 5 memory locations differ.
-Referring to Scenario 12-4, which test would be used to properly analyze the data in this experiment?
(Multiple Choice)
4.9/5 (37)
SCENARIO 12-3 The director of transportation of a large company is interested in the usage of her van pool.She considers her routes to be divided into local and non-local.She is particularly interested in learning if there is a difference in the proportion of males and females who use the local routes. She takes a sample of a day's riders and finds the following: 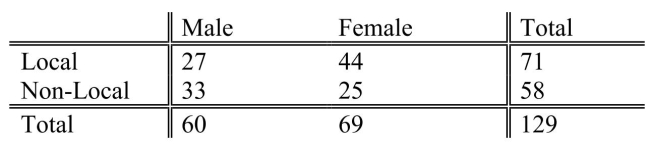 She will use this information to perform a chi-square hypothesis test using a level of significance of 0.05.
-Referring to Scenario 12-3, the expected cell frequency in the Female/Non-Local cell is __________.
She will use this information to perform a chi-square hypothesis test using a level of significance of 0.05.
-Referring to Scenario 12-3, the expected cell frequency in the Female/Non-Local cell is __________.
(Short Answer)
4.9/5 (31)
SCENARIO 12-6 According to an article in Marketing News, fewer checks are being written at the grocery store checkout than in the past.To determine whether there is a difference in the proportion of shoppers who pay by check among three consecutive years at a 0.05 level of significance, the results of a survey of 500 shoppers in three consecutive years are obtained and presented below. 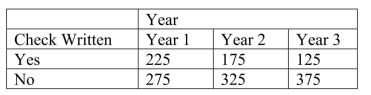 -Referring to Scenario 12-6, the assumptions needed to perform the test are satisfied.
(True/False)
4.9/5 (39)
SCENARIO 12-12 Parents complain that children read too few storybooks and watch too much television nowadays.A survey of 1,000 children reveals the following information on average time spent watching TV and average time spent reading storybooks
-Referring to Scenario 12-12, we want to test whether there is any relationship between average time spent watching TV and average time spent reading storybooks.Suppose the value of the test statistic was 164 (which is not the correct answer)and the critical value was 19.00 (which is not the correct answer), then we could conclude that
(Multiple Choice)
4.9/5 (30)
SCENARIO 12-17 Three new different models of compact SUVs have just arrived at the market.You are interested in comparing the gas mileage performance of all three models to see if they are the same.A partial computer output for twelve compact SUVs of each model is given below: You are told that the gas mileage population distributions for all three models are not normally distributed.
-Referring to Scenario 12-17, what is the critical value of the Kruskal-Wallis test statistic?
(Short Answer)
4.8/5 (37)
SCENARIO 12-7 Data on the percentage of 200 hotels in each of the three large cities across the world on whether minibar charges are correctly posted at checkout are given below. 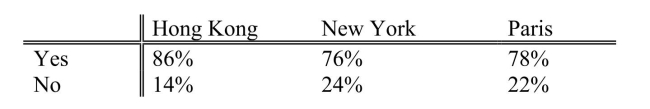 At the 0.05 level of significance, you want to know if there is evidence of a difference in the proportion of hotels that correctly post minibar charges among the three cities.
-Referring to Scenario 12-7, the decision made suggests that the 3 cities do not all have the same proportion of hotels that correctly post minibar charges.
At the 0.05 level of significance, you want to know if there is evidence of a difference in the proportion of hotels that correctly post minibar charges among the three cities.
-Referring to Scenario 12-7, the decision made suggests that the 3 cities do not all have the same proportion of hotels that correctly post minibar charges.
(True/False)
4.8/5 (25)
SCENARIO 12-6 According to an article in Marketing News, fewer checks are being written at the grocery store checkout than in the past.To determine whether there is a difference in the proportion of shoppers who pay by check among three consecutive years at a 0.05 level of significance, the results of a survey of 500 shoppers in three consecutive years are obtained and presented below.
-Referring to Scenario 12-6, what is the expected number of shoppers who pay by check in year 1 if there is no difference in the proportion of shoppers who pay by check among the three years?
(Short Answer)
4.9/5 (41)
SCENARIO 12-13 Recent studies have found that American children are more obese than in the past.The amount of time children spent watching television has received much of the blame.A survey of 100 ten- year-olds revealed the following with regards to weights and average number of hours a day spent watching television.We are interested in testing whether the mean number of hours spent watching TV and weights are independent at 1% level of significance. 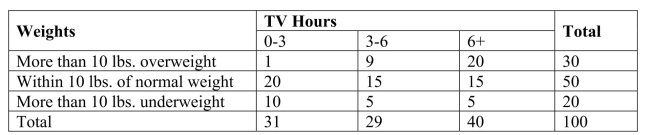 -Referring to Scenario 12-13, the critical value of the test will be
(Multiple Choice)
4.9/5 (41)
SCENARIO 12-10 One criterion used to evaluate employees in the assembly section of a large factory is the number of defective pieces per 1,000 parts produced.The quality control department wants to find out whether there is a relationship between years of experience and defect rate.Since the job is repetitious, after the initial training period any improvement due to a learning effect might be offset by a loss of motivation.A defect rate is calculated for each worker in a yearly evaluation. The results for 100 workers are given in the table below. 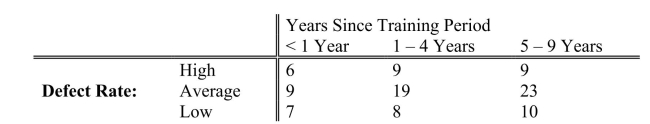 -Referring to Scenario 12-10, for the cell with 1 to 4 years of training time and a high defect rate, what is the contribution to the overall
  statistic for the independence test?
(Multiple Choice)
5.0/5 (36)
SCENARIO 12-9 Many companies use well-known celebrities as spokespersons in their TV advertisements.A study was conducted to determine whether brand awareness of female TV viewers and the gender of the spokesperson are independent.Each in a sample of 300 female TV viewers was asked to identify a product advertised by a celebrity spokesperson.The gender of the spokesperson and whether or not the viewer could identify the product was recorded.The numbers in each category are given below. 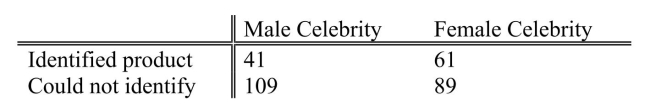 -Referring to Scenario 12-9, the calculated test statistic is
(Multiple Choice)
4.8/5 (35)
SCENARIO 12-3 The director of transportation of a large company is interested in the usage of her van pool.She considers her routes to be divided into local and non-local.She is particularly interested in learning if there is a difference in the proportion of males and females who use the local routes. She takes a sample of a day's riders and finds the following: She will use this information to perform a chi-square hypothesis test using a level of significance of 0.05.
-Referring to Scenario 12-3, the null hypothesis will be rejected.
(True/False)
4.9/5 (39)
SCENARIO 12-9 Many companies use well-known celebrities as spokespersons in their TV advertisements.A study was conducted to determine whether brand awareness of female TV viewers and the gender of the spokesperson are independent.Each in a sample of 300 female TV viewers was asked to identify a product advertised by a celebrity spokesperson.The gender of the spokesperson and whether or not the viewer could identify the product was recorded.The numbers in each category are given below.
-Referring to Scenario 12-9, the degrees of freedom of the test statistic are
(Multiple Choice)
4.9/5 (37)
SCENARIO 12-13 Recent studies have found that American children are more obese than in the past.The amount of time children spent watching television has received much of the blame.A survey of 100 ten- year-olds revealed the following with regards to weights and average number of hours a day spent watching television.We are interested in testing whether the mean number of hours spent watching TV and weights are independent at 1% level of significance.
-Referring to Scenario 12-13, how many children in the survey spend more than 6 hours watching TV and are more than 10 lbs.overweight?
(Multiple Choice)
4.8/5 (37)
Filters
- Essay(0)
- Multiple Choice(0)
- Short Answer(0)
- True False(0)
- Matching(0)