Exam 14: Analysis of Variance
Exam 1: What Is Statistics41 Questions
Exam 2: Graphical and Tabular Descriptive Techniques199 Questions
Exam 3: Numerical Descriptive Techniques226 Questions
Exam 4: Data Collection and Sampling82 Questions
Exam 5: Probability212 Questions
Exam 6: Random Variables and Discrete Probability Distributions174 Questions
Exam 7: Continuous Probability Distributions167 Questions
Exam 8: Sampling Distributions133 Questions
Exam 9: Introduction to Estimation88 Questions
Exam 10: Introduction to Hypothesis Testing186 Questions
Exam 11: Inference About a Population76 Questions
Exam 12: Inference About Comparing Two Populat85 Questions
Exam 13: Inference About Comparing Two Populat85 Questions
Exam 14: Analysis of Variance127 Questions
Exam 15: Chi-Squared Tests118 Questions
Exam 16: Simple Linear Regression and Correlat238 Questions
Exam 17: Multiple Regression147 Questions
Exam 18: Review of Statistical Inference189 Questions
Select questions type
In ANOVA, the F -test is the ratio of two sample variances. In the one-way ANOVA (completely randomized design), the variance used as a numerator of the ratio is:
Free
(Multiple Choice)
4.8/5  (35)
(35)
Correct Answer: Verified
A
Health Inspectors' Ages In order to examine the differences in ages of health inspectors among five counties, a Health Department statistician took random samples of six inspectors' ages in each county. The data are listed below. An F -test using ANOVA showed that average age differs for at least two counties. 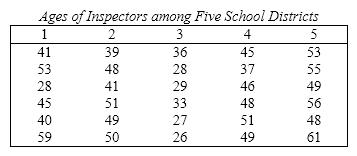 {Health Inspectors' Ages Narrative} Use Fisher's LSD procedure with a = .05 to determine which population means differ.
Free
(Essay)
4.9/5 (31)
Correct Answer:Verified
LSD = 7.613 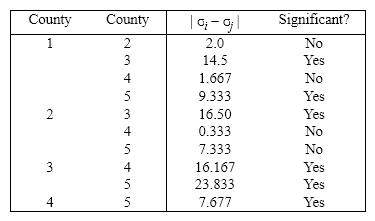 The mean for district 3 is significantly different from the mean for each of the other districts. Note that the sample means are found to be 44.3, 46.3, 29.8, 46.0, and 53.7 years, respectively. From this we conclude that the mean age for district 3 teachers is statistically lower than the other districts, according to this data.
Arthritis Pain Formulas A pharmaceutical manufacturer has been researching new medications formulas to provide quicker relief of arthritis pain. Their laboratories have produced three different medications and they want to determine if the different medications produce different responses. Fifteen people who complained of arthritis pains were recruited for an experiment; five were randomly assigned to each medication. Each person was asked to take the medicine and report the length of time until some relief was felt (minutes). The results are shown below. (Assume normal distributions with equal variances.) 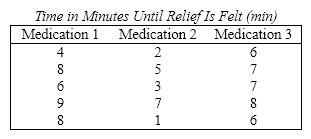 {Arthritis Pain Formulas Narrative} Do these data provide sufficient evidence to indicate that differences in the average time of relief exist among the three medications? Use a = 0.05.
Free
(Essay)
4.8/5 (36)
Correct Answer:Verified
H 0: m 1 = m 2 = m 3 vs. H 1: At least two means differ Conclusion: Reject the null hypothesis. Yes, differences in the mean time of relief exist in at least two of the three medications, according to this data.
One-way ANOVA is applied to independent samples taken from three normally distributed populations with equal variances. Which of the following is the null hypothesis for this procedure?
(Multiple Choice)
4.9/5 (40)
TV News Viewing Habits A statistician employed by a television rating service wanted to determine if there were differences in television viewing habits among three different cities in New York. She took a random sample of five adults in each of the cities and asked each to report the number of hours spent watching television in the previous week. The results are shown below. (Assume normal distributions with equal variances.) 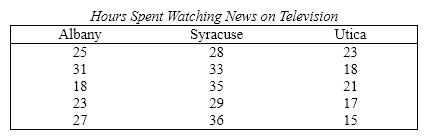 {TV News Viewing Habits Narrative} Can she infer at the 5% significance level that differences in hours of television watching exist among the three cities?
(Essay)
4.9/5 (41)
The primary interest of designing a randomized block experiment is to:
(Multiple Choice)
4.8/5 (34)
Acid Reflux A partial ANOVA table in a randomized block design is shown below, where the treatments refer to different acid reflux medicines, and the blocks refer to groups of men with similar levels of stomach acid. 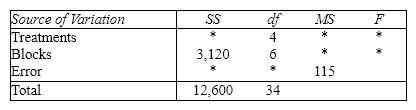 {Acid Reflux Narrative} Fill in the missing values (identified by asterisks)in the above ANOVA Table.
(Essay)
4.8/5 (31)
A randomized block experiment having five treatments and six blocks produced the following values: SST = 252, SS(Total)= 1,545, SSE = 198. The value of SSB must be 1095.
(True/False)
4.8/5 (36)
In which case can an F -test be used to compare two population means?
(Multiple Choice)
4.8/5 (33)
The analysis of variance (ANOVA)tests hypotheses about population variances and requires all the population means to be equal.
(True/False)
4.8/5 (31)
Health Inspectors' Ages In order to examine the differences in ages of health inspectors among five counties, a Health Department statistician took random samples of six inspectors' ages in each county. The data are listed below. An F -test using ANOVA showed that average age differs for at least two counties.  {Health Inspectors' Ages Narrative} Did Tukey's method and Fisher's LSD method in the previous two questions yield the same results? Will this always be the case?
(Essay)
4.7/5 (33)
The Bonferroni adjustment to Fisher's Least Significant Difference (LSD)multiple comparison method is made by dividing the specified experimentwise Type I error rate by the number of pairs of population means.
(True/False)
4.8/5 (34)
In one-way ANOVA, the total variation SS(Total)is partitioned into two sources of variation: the sum of squares for treatments (SST)and the sum of squares for error (SSE).
(True/False)
4.8/5 (43)
Gold Funds An investor studied the percentage rates of return of three different gold funds. Random samples of percentage rates of return for four periods were taken from each fund. The results appear in the table below: 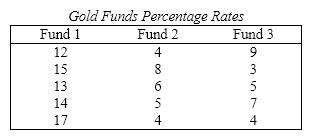 {Gold Funds Narrative} Test at the 5% significance level to determine whether the mean percentage rates for the three funds differ.
(Essay)
4.9/5 (36)
Which of the following statements about multiple comparison methods is false?
(Multiple Choice)
4.9/5 (35)
Food Irradiation In recent years the irradiation of food to reduce bacteria and preserve the food longer has become more common. A company that performs this service has developed four different methods of irradiating food. To determine which is best, it conducts an experiment where different foods are irradiated and the bacteria count is measured. As part of the experiment the following foods are irradiated: meat, poultry, veal, tuna, and yogurt. The results are shown below. 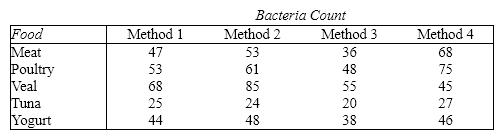 {Food Irradiation Narrative} Can the company infer at the 1% significance level that differences in the bacteria count exist among the four irradiation methods?
(Essay)
4.8/5 (36)
The techniques used to detect which population means differ are called multiple ____________________ methods.
(Short Answer)
4.8/5 (43)
Fisher's least significant difference method (LSD)substitutes the pooled variance estimator from the equal variances t -test with the MSE from ANOVA.
(True/False)
4.9/5 (33)
The sum of squares for error is also known as the between-treatments variation.
(True/False)
4.8/5 (42)
Filters
- Essay(0)
- Multiple Choice(0)
- Short Answer(0)
- True False(0)
- Matching(0)