Exam 15: Chi-Squared Tests
Exam 1: What Is Statistics41 Questions
Exam 2: Graphical and Tabular Descriptive Techniques199 Questions
Exam 3: Numerical Descriptive Techniques226 Questions
Exam 4: Data Collection and Sampling82 Questions
Exam 5: Probability212 Questions
Exam 6: Random Variables and Discrete Probability Distributions174 Questions
Exam 7: Continuous Probability Distributions167 Questions
Exam 8: Sampling Distributions133 Questions
Exam 9: Introduction to Estimation88 Questions
Exam 10: Introduction to Hypothesis Testing186 Questions
Exam 11: Inference About a Population76 Questions
Exam 12: Inference About Comparing Two Populat85 Questions
Exam 13: Inference About Comparing Two Populat85 Questions
Exam 14: Analysis of Variance127 Questions
Exam 15: Chi-Squared Tests118 Questions
Exam 16: Simple Linear Regression and Correlat238 Questions
Exam 17: Multiple Regression147 Questions
Exam 18: Review of Statistical Inference189 Questions
Select questions type
All of the expected frequencies in a chi-squared goodness-of-fit test must be equal to each other.
Free
(True/False)
4.8/5  (21)
(21)
Correct Answer: Verified
False
Student Absenteeism Consider a multinomial experiment involving n = 200 students of a large high school. The attendance department recorded the number of students who were absent during the weekdays. The null hypothesis to be tested is: H 0: p 1 = 0.10, p 2 = 0.25, p 3 = 0.30, p 4 = 0.20, p 5 = 0.15. {Student Absenteeism Narrative} Test the hypothesis at the 5% level of significance with the following frequencies: 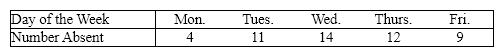
Free
(Essay)
4.8/5 (36)
Correct Answer:Verified
Rejection region: c 2 > c 20.05,4 = 9.488 Test statistic: c 2 = 1.147 Conclusion: Cannot reject the null hypothesis. There is not enough evidence to conclude that absenteeism patterns differ throughout the week.
To determine whether a single coin is fair, the coin was tossed 200 times. The observed frequencies with which each of the two sides of the coin turned up are recorded as 112 heads and 88 tails. Is the coin fair?
Free
(Essay)
4.9/5 (27)
Correct Answer:Verified
H 0: p 1 = 0.50, p 2 = 0.50 (the coin is fair)H 1: At least one pi is not equal to its specified value (the coin is not fair)Rejection region: c 2 > c 20.05,1 = 3.841 Test statistic: c 2 = 2.88 Conclusion: Cannot reject the null hypothesis. There is not enough evidence to say the coin is not fair, according to the data.
In the test of a contingency table, the expected cell frequencies must satisfy the rule of 5.
(True/False)
4.9/5 (35)
In 2011, the student body of a state university in Alabama consists of 30% freshmen, 25% sophomores, 27% juniors, and 18% seniors. A sample of 400 students taken from the 2012 student body showed that there are 138 freshmen, 88 sophomores, 94 juniors, and 80 seniors. Test with 5% significance level to determine whether the student body proportions have changed.
(Essay)
4.9/5 (35)
If there are only two categories, the chi-squared goodness-of-fit test is the same as the z -test for p , the population proportion (as long as the sample\cell sizes meet the conditions).
(True/False)
5.0/5 (33)
A calculus professor posted the following grade distribution guidelines for her elementary calculus class: 8% A, 35% B, 40% C, 12% D, and 5% F. A sample of 100 elementary statistics grades at the end of last semester showed 12 As, 30 Bs, 35 Cs, 15 Ds, and 8 Fs. Test at the 5% significance level to determine whether the actual grades deviate significantly from the posted grade distribution guidelines.
(Essay)
4.9/5 (33)
A chi-squared test statistic in a test of a contingency table that is equal to zero means:
(Multiple Choice)
4.8/5 (37)
Seat Belts A study was conducted to determine whether the use of seat belts in vehicles depends on whether or not a child was present in the car. A sample of 1,000 people treated for injuries sustained from vehicle accidents was obtained, and each person was classified according to (1)child present (yes\no)and (2)seat belt usage (worn or not worn)during the accident. The data are shown in the table below.
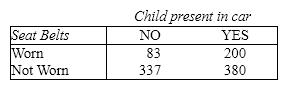 {Seat Belts Narrative} Calculate the value of the test statistic.
(Essay)
4.8/5 (38)
Which of the following conditions indicate that H 0 should be rejected in a goodness-of-fit test?
(Multiple Choice)
4.8/5 (35)
Consider a multinomial experiment involving 100 trials and 3 categories (cells). The observed frequencies resulting from the experiment are shown in the accompanying table.
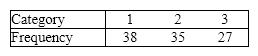 Use the 5% significance level to test the hypotheses H 0: p 1 = 0.45, p 2 = 0.30, p 3 = 0.25 vs. H 1: At least two proportions differ from their specified values.
(Essay)
4.9/5 (30)
A chi-squared goodness-of-fit test is always conducted as a(n):
(Multiple Choice)
4.9/5 (37)
A chi-squared test of a contingency table is applied to a contingency table with 4 rows and 4 columns for two qualitative variables. The degrees of freedom for this test must be 9.
(True/False)
4.7/5 (32)
A sports preference poll showed the following data for adults and children:
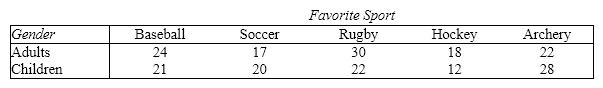 Use the 5% level of significance and test to determine whether sports preferences depend on age group.
(Essay)
4.8/5 (31)
To determine the critical values in the chi-squared distribution table, you need to know the:
(Multiple Choice)
4.9/5 (34)
The expected values of a contingency table are calculated based on the assumption that H 0 is ____________________.
(Short Answer)
4.8/5 (33)
Explain what is meant by the rule of five and what you should do if this rule is not met.
(Essay)
4.8/5 (43)
How do you find the probabilities needed to obtain expected frequencies for a test of a contingency table?
(Multiple Choice)
4.9/5 (35)
In the test of a contingency table, the observed cell frequencies must satisfy the rule of 5.
(True/False)
4.8/5 (33)
Suppose the value of your chi-squared test statistic in a goodness-of-fit test is equal to 0. What do you conclude?
(Multiple Choice)
4.8/5 (39)
Filters
- Essay(0)
- Multiple Choice(0)
- Short Answer(0)
- True False(0)
- Matching(0)