Exam 3: Numerical Descriptive Techniques
Exam 1: What Is Statistics41 Questions
Exam 2: Graphical and Tabular Descriptive Techniques199 Questions
Exam 3: Numerical Descriptive Techniques226 Questions
Exam 4: Data Collection and Sampling82 Questions
Exam 5: Probability212 Questions
Exam 6: Random Variables and Discrete Probability Distributions174 Questions
Exam 7: Continuous Probability Distributions167 Questions
Exam 8: Sampling Distributions133 Questions
Exam 9: Introduction to Estimation88 Questions
Exam 10: Introduction to Hypothesis Testing186 Questions
Exam 11: Inference About a Population76 Questions
Exam 12: Inference About Comparing Two Populat85 Questions
Exam 13: Inference About Comparing Two Populat85 Questions
Exam 14: Analysis of Variance127 Questions
Exam 15: Chi-Squared Tests118 Questions
Exam 16: Simple Linear Regression and Correlat238 Questions
Exam 17: Multiple Regression147 Questions
Exam 18: Review of Statistical Inference189 Questions
Select questions type
Milk Demand A supermarket has determined that daily demand for milk containers has an approximate bell shaped distribution, with a mean of 55 containers and a standard deviation of six containers. {Milk Demand Narrative} What percentage of the time will the number of containers of milk sold be more than 2 standard deviations from the mean?
Free
(Essay)
4.7/5  (28)
(28)
Correct Answer: Verified
Approximately 5% by the Empirical Rule.
If the first and second quartiles are farther apart than the second and third quartiles, the shape of the histogram based on the quartiles is ____________________.
Free
(Short Answer)
4.7/5 (30)
Correct Answer:Verified
negatively skewed
Which measure of central location can be used for both interval and nominal variables?
Free
(Multiple Choice)
4.9/5 (34)
Correct Answer:Verified
C
The standard deviation is expressed in terms of the original units of measurement but the variance is not.
(True/False)
4.8/5 (36)
Longevity and Salary A sample of eight observations of variables x (years of experience)and y (salary in $1,000s)is shown below: 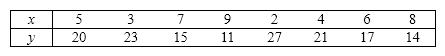 {Longevity and Salary Narrative}
a. Calculate the coefficient of correlation, and comment on the relationship between x and y .
b. Give a possible reason that the correlation is negative.
{Longevity and Salary Narrative}
a. Calculate the coefficient of correlation, and comment on the relationship between x and y .
b. Give a possible reason that the correlation is negative.
(Essay)
4.9/5 (35)
The units for the variance are the same as the units for the original data (for example, feet, inches, etc.).
(True/False)
4.9/5 (37)
Quartiles divide the observations in a data set into four parts with the same amount of data in each part.
(True/False)
4.8/5 (32)
Ages of Jockeys The following data represent the ages in years of a sample of 25 jockeys from a local race track: 31, 43, 56, 23, 49, 42, 33, 61, 44, 28, 48, 38, 44, 35, 40, 64, 52, 42, 47, 39, 53, 27, 36, 35, and 20. {Ages of Jockeys Narrative}
a. Construct a box plot for the ages and identify any extreme values.
b. What does the box plot tell you about the distribution of the data?
(Essay)
4.9/5 (34)
In a negatively skewed distribution, the mean is smaller than the median and the median is smaller than the mode.
(True/False)
4.9/5 (38)
Weights of Teachers The following data represent the weights in pounds of a sample of 25 teachers: 164, 148, 137, 157, 173, 156, 177, 172, 169, 165, 145, 168, 163, 162, 174, 152, 156, 168, 154, 151, 174, 146, 134, 140, and 171. {Weights of Teachers Narrative} Compute the sample variance, and sample standard deviation.
(Essay)
4.9/5 (40)
In symmetric data, the value for Q 2 is always halfway between Q 1 and Q 3.
(True/False)
4.8/5 (42)
The data set 10, 20, 30 has the same variance as the data set 100, 200, 300.
(True/False)
4.8/5 (45)
The number of hours a college student spent studying during the final exam week was recorded as follows: 7,6, 4, 9, 8, 5, and 10. Compute  for the data and the value in an appropriate unit.
(Essay)
4.8/5 (40)
Salaries of Office Workers The following data represent the salaries (in thousands of dollars)of a sample of 13 office workers of a firm: 26.5, 23.5, 29.7, 24.8, 21.1, 24.3, 20.4, 22.7, 27.2, 23.7, 24.1, 24.8, and 28.2. {Salaries of Office Workers Narrative} Compute the variance, and standard deviation of the salaries, and express the numbers in the appropriate units.
(Essay)
4.9/5 (46)
Ages of Retirees A sociologist recently conducted a survey of retirees over 65 years of age whose net worth is too high to qualify for Medicaid and who have no private health insurance. The ages of 20 uninsured retirees were as follows: 65, 66, 67, 68, 69, 70, 71, 73, 74, 75, 78, 79, 80, 81, 86, 87, 91, 92, 94, and 97. {Ages of Retirees Narrative} What does the value of the first quartile tell you?
(Essay)
4.7/5 (30)
Weights of Police Officers The following data represent the weights in pounds of a sample of 25 police officers: 164, 148, 137, 157, 173, 156, 177, 172, 169, 165, 145, 168, 163, 162, 174, 152, 156, 168, 154, 151, 174, 146, 134, 140, and 171. {Weights of Police Officers Narrative} Describe the shape of the distribution of weights based on the quartiles' values.
(Essay)
4.8/5 (34)
The sample mean is denoted by ____________________ and the population mean is denoted by ____________________.
(Not Answered)
This question doesn't have any answer yet
Computers The following data represent the number of computers owned by a sample of 10 families from Chicago: 4, 2, 1, 1, 5, 3, 0, 1, 0, and 2. {Computers Narrative} Compute the mean number of computers.
(Essay)
4.8/5 (32)
Test Scores Suppose that an analysis of a set of test scores reveals that: Q 1 = 45, Q 2 = 85, Q 3 = 105. {Test Scores Narrative} What can you say about the relative position of each of the observations 34, 84, and 104, within this data set?
(Essay)
4.7/5 (36)
Filters
- Essay(0)
- Multiple Choice(0)
- Short Answer(0)
- True False(0)
- Matching(0)