Exam 16: Inserting and Formatting Charts
Exam 1: Introduction to Computers and the Internet74 Questions
Exam 2: Computer Hardware78 Questions
Exam 3: Computer Software75 Questions
Exam 4: Computer Networks75 Questions
Exam 5: The Internet and Email75 Questions
Exam 6: Security and Privacy74 Questions
Exam 7: Exploring Windows 10 and Managing Files82 Questions
Exam 8: Using Edge Mail and People74 Questions
Exam 9: Introducing Microsoft Office 201674 Questions
Exam 10: Creating a Document74 Questions
Exam 11: Formatting a Long Document74 Questions
Exam 12: Enhancing a Document74 Questions
Exam 13: Creating a Workbook74 Questions
Exam 14: Working With Formulas and Functions77 Questions
Exam 15: Creating an Advanced Workbook74 Questions
Exam 16: Inserting and Formatting Charts74 Questions
Exam 17: Creating a Database74 Questions
Exam 18: Maintaining and Querying a Database74 Questions
Exam 19: Creating Forms and Reports74 Questions
Exam 20: Creating Apresentation76 Questions
Exam 21: Enhancing a Presentation74 Questions
Exam 22: Integrating Word, Excel, Access and Powerpoint74 Questions
Select questions type
A(n) _________ is a fusion of two or more chart types in a single graph, such as a column chart and a line chart.
A)treemap chart
B)area chart
C)combo chart
D)sunburst chart
(Short Answer)
4.9/5  (43)
(43)
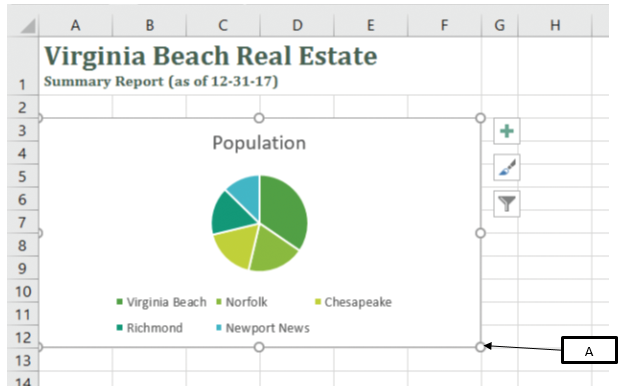
In the accompanying image of Microsoft Excel 2016, box "A" points to _____.
(Multiple Choice)
4.9/5 (29)
Which of the following is a disadvantage of an embedded chart?
(Multiple Choice)
4.8/5 (39)
Identify a true statement about data source of pie charts.
(Multiple Choice)
4.8/5 (33)
Sarah, a microbiologist, collects data on the types of bacteria and the amount of each type of bacteria found in the soil. She creates a 3-D pie chart to represent this data. However, she realizes that the 3-D pie chart lacks clarity and intends to change it to a 2-D pie chart. In this scenario, which of the following options should Sarah use to modify the appearance of the chart?
(Multiple Choice)
4.8/5 (30)
Judith, a management student, creates a graph showing the number of start-ups commenced in her country in the year 2015. She uses a pie chart to represent her data. Judith, while reviewing her graph, feels that she should change the colors of the pies since she had used a dark colored background. In this scenario, Judith should click the _____ to change the color of the pies.
(Multiple Choice)
4.7/5 (38)
The chart styles are located in the Chart Layouts group, which is available on the Chart Tools Format tab.
(True/False)
4.9/5 (36)
When data bars are used with negative values, the data bars originate from the bottom of a cell with negative bars extending to the right and positive bars extending to the left.
(True/False)
4.9/5 (37)
In Microsoft Excel Charts, a _________ is the range that contains the data to display in a chart.
A)data type
B)chart area
C)chart element
D)data source
(Short Answer)
4.8/5 (38)
In Microsoft Excel Charts, a _________ is a set of values that represent data for one item in a chart.
A)category
B)cluster
C)quotient
D)legend
(Short Answer)
4.8/5 (39)
The _________ button is used to create data bars.
A)What-If Analysis
B)Conditional Formatting
C)Data Validation
D)Forecast Sheet
(Short Answer)
4.8/5 (41)
A _________ is a horizontal bar that is always placed in the cell containing the value it represents.
A)space bar
B)data bar
C)taskbar
D)toolbar
(Short Answer)
4.8/5 (42)
Celina, a Human Resource (HR) manager, creates a graph on an Excel sheet representing the attrition rate in the past five years in her company. She presents the graph such that the graph area occupies the entire worksheet without any worksheet cells. In this case, Celina presents a _____.
(Multiple Choice)
4.8/5 (33)
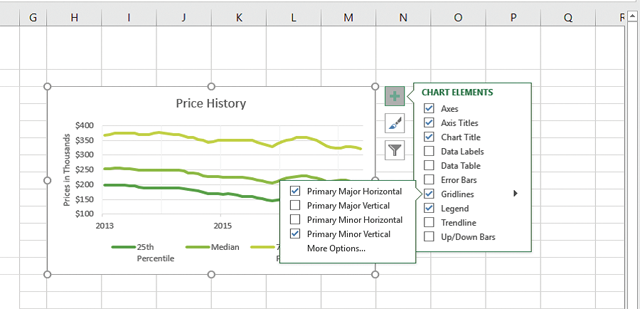
In the accompanying image of Microsoft Excel 2016, box "A" points to the _____.
(Multiple Choice)
4.8/5 (46)
You can change the appearance of the lines and data markers in a line chart using the Marker Options in the Format Data Series pane.
(True/False)
4.7/5 (36)
The _________ tab provides a gallery of column chart layouts and a gallery of column chart styles and access to the individual chart elements you can include on a column chart.
A)Chart Tools Design
B)Chart Tools Format
C)Chart Tools Data
D)Chart Tools View
(Short Answer)
4.8/5 (39)
Filters
- Essay(0)
- Multiple Choice(0)
- Short Answer(0)
- True False(0)
- Matching(0)