Exam 16: Inserting and Formatting Charts
Exam 1: Introduction to Computers and the Internet74 Questions
Exam 2: Computer Hardware78 Questions
Exam 3: Computer Software75 Questions
Exam 4: Computer Networks75 Questions
Exam 5: The Internet and Email75 Questions
Exam 6: Security and Privacy74 Questions
Exam 7: Exploring Windows 10 and Managing Files82 Questions
Exam 8: Using Edge Mail and People74 Questions
Exam 9: Introducing Microsoft Office 201674 Questions
Exam 10: Creating a Document74 Questions
Exam 11: Formatting a Long Document74 Questions
Exam 12: Enhancing a Document74 Questions
Exam 13: Creating a Workbook74 Questions
Exam 14: Working With Formulas and Functions77 Questions
Exam 15: Creating an Advanced Workbook74 Questions
Exam 16: Inserting and Formatting Charts74 Questions
Exam 17: Creating a Database74 Questions
Exam 18: Maintaining and Querying a Database74 Questions
Exam 19: Creating Forms and Reports74 Questions
Exam 20: Creating Apresentation76 Questions
Exam 21: Enhancing a Presentation74 Questions
Exam 22: Integrating Word, Excel, Access and Powerpoint74 Questions
Select questions type
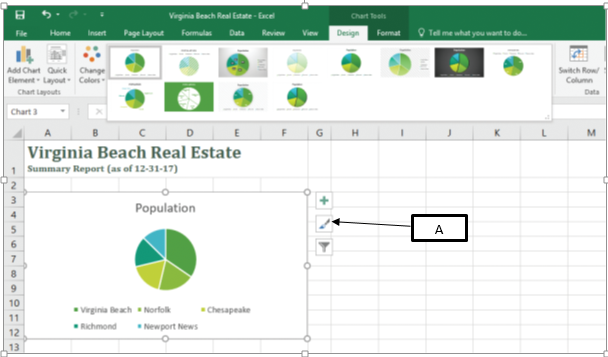
In the accompanying image of Microsoft Excel 2016, box "A" points to the _____.
(Multiple Choice)
4.8/5  (37)
(37)
A _________ is the type of chart on Microsoft Excel that does not include chart elements such as legends, titles, gridlines, or axes.
A)sparkline
B)gridline
C)timeline
D)streamline
(Short Answer)
4.9/5 (34)
Case 16-1 George, an environmental scientist, collects information on the types and amount of gases emitted by a cheese processing factory.
George decides to present the data on an Excel sheet in the form of bars against X and Y axes. In this scenario, George presents the data in the form of a _____.
(Multiple Choice)
4.9/5 (43)
Lena, a professor, creates a bar graph displaying the performance of her students. She needs to choose a bar graph template with chart elements appropriately placed to suit her requirement. In this scenario, which of the following options should Lena use?
(Multiple Choice)
5.0/5 (43)
Which of the following is an accurate statement about overlaying chart elements?
(Multiple Choice)
4.7/5 (34)
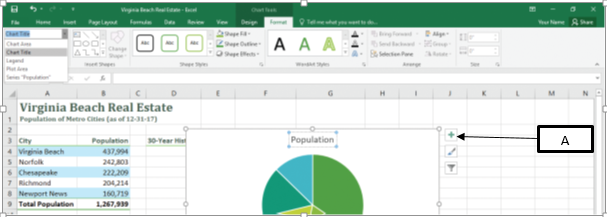
In the accompanying image of Microsoft Excel 2016, box "A" points to the _____.
(Multiple Choice)
4.9/5 (28)
In Microsoft Excel, which of the following is true of a chart legend?
(Multiple Choice)
4.9/5 (37)
Pie charts are typically used when the data consists of values drawn from categories that follow a sequential order at evenly spaced intervals.
(True/False)
4.8/5 (47)
Eugene, a financial analyst, collects data on the gross income of people working in different industries. She presents this data in a bar graph. However, she later feels that a line graph will be more appropriate for representing the data. In this scenario, Eugene should click the _____ in the Excel sheet to change the graph type.
(Multiple Choice)
4.9/5 (35)
Which of the following is an advantage of overlaying chart elements?
(Multiple Choice)
4.7/5 (28)
The _________ shows the patterns or relationship between two or more sets of values.
A)Box & Whisker Chart
B)Sunburst Chart
C)X Y (Scatter) Chart
D)Surface Chart
(Short Answer)
4.9/5 (38)
Filters
- Essay(0)
- Multiple Choice(0)
- Short Answer(0)
- True False(0)
- Matching(0)