Exam 3: Linear Equations With Two Variables
Exam 1: Building Blocks of Algebra379 Questions
Exam 2: Linear Equations and Inequalities With One Variable241 Questions
Exam 3: Linear Equations With Two Variables340 Questions
Exam 4: Systems of Linear Equations278 Questions
Exam 5: Exponents and Polynomials262 Questions
Exam 6: Factoring and Quadratic Equations288 Questions
Exam 7: Rational Expressions and Equations271 Questions
Exam 8: Radical Expressions and Equations237 Questions
Exam 9: Modeling Data74 Questions
Select questions type
The model 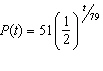 describes the amount of Cesium-137 remaining after t years. Which one of the following written statements best describes the behavior of Cesium-137?
(Multiple Choice)
4.8/5  (24)
(24)
The amount of student loan debt that you have can be estimated by the equation 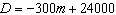 where D is student loan debt in dollars m months after you start paying off the debt. Graph this equation.
(Essay)
4.9/5 (33)
Using the following table find the percentage rate of change in f from 0 to 1. 
(Multiple Choice)
4.8/5 (32)
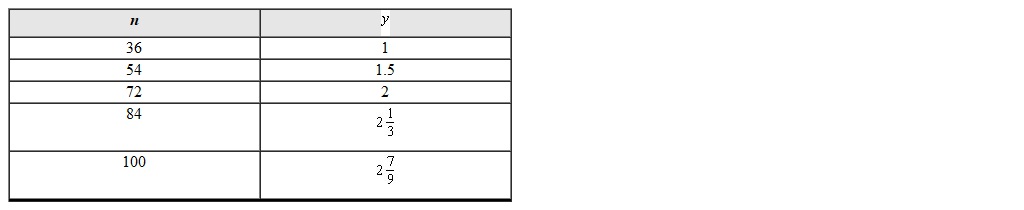
There is a linear relationship between the number of inches n and the number of yards y. The following table lists some conversions between the number of yards and the number of inches. Find the equation of the line that describes that relationship.
(Essay)
4.8/5 (23)
Decide whether you would graph the equation  by using the slope and y- intercept the x- and y -intercepts or by building a table of points to plot.
(Multiple Choice)
4.8/5 (34)
The percent rate of change for the increase in bees per day for time 0 to 2 days is 7.46%.

(True/False)
4.9/5 (27)
Determine whether the equation  is linear. If it is linear put it into slope-intercept form.
(Essay)
4.8/5 (25)
Find the slope of the line that goes through the points  and
and  .
.
(Multiple Choice)
4.8/5 (21)
The model 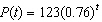 describes the amount of a radioactive substance (in grams) remaining after t hours. Which one of the following written statements best describes this population?
(Multiple Choice)
4.7/5 (30)
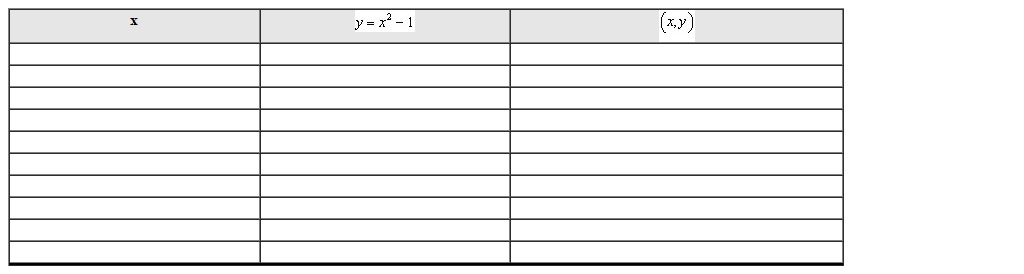
Use the equation to create a table of nine or more points and graph them. Connect the points with a smooth curve. Clearly label and scale the axes.
(Essay)
4.8/5 (24)
Use the graph to find the equation of the line. Put the answer in  form.
form. 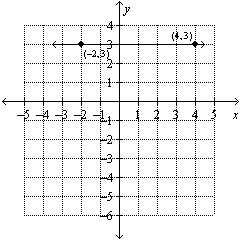
(Essay)
4.8/5 (40)
A certain region started with 187 wild coyotes. Due to drought the region had only 46 coyotes remaining after 6 months. Which of the following is the 6-month decay factor (rounded to the nearest hundredth)?
(Multiple Choice)
4.9/5 (30)
Graph the equation  using the x- and y- intercepts. Clearly label and scale the intercepts. Graph this equation.
(Essay)
4.9/5 (44)
The data table represents hours you work h and your pay P . Is the graph of the equation linear or nonlinear? 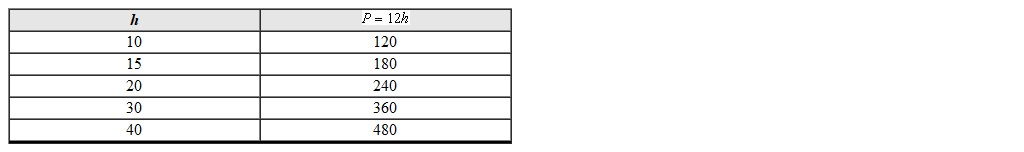
(Multiple Choice)
4.7/5 (28)
Determine the equation of the line that passes through the given points. Put the final answer in  form. Points:
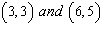
(Essay)
4.8/5 (24)
Use any two points from the table to calculate the slope of the line that passes through the points. 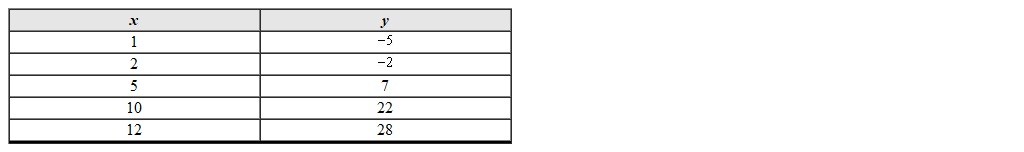
(Multiple Choice)
4.8/5 (28)
Graph the equation  using the x- and y- intercepts. Clearly label and scale the intercepts. Graph this equation.
(Essay)
4.8/5 (35)
Filters
- Essay(0)
- Multiple Choice(0)
- Short Answer(0)
- True False(0)
- Matching(0)