Exam 3: Linear Equations With Two Variables
Exam 1: Building Blocks of Algebra379 Questions
Exam 2: Linear Equations and Inequalities With One Variable241 Questions
Exam 3: Linear Equations With Two Variables340 Questions
Exam 4: Systems of Linear Equations278 Questions
Exam 5: Exponents and Polynomials262 Questions
Exam 6: Factoring and Quadratic Equations288 Questions
Exam 7: Rational Expressions and Equations271 Questions
Exam 8: Radical Expressions and Equations237 Questions
Exam 9: Modeling Data74 Questions
Select questions type
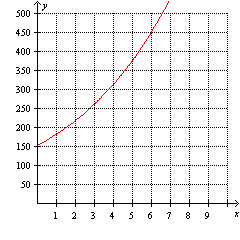
Using the graph below find the percentage rate of change from  to
to  .
. 
(Multiple Choice)
4.9/5  (35)
(35)
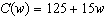 is a function that represents the cost in dollars to make w widgets. Find w such that
  .
.
(Essay)
4.7/5 (33)
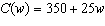 is a function that represents the cost in dollars to make w wheels. Find w such that
  .
.
(Multiple Choice)
4.9/5 (37)
Every relationship between an input and an output is a function.
(True/False)
4.8/5 (34)
Using the following table of a function that models exponential growth determine the one-year growth factor (rounded to the nearest hundredth). 
(Multiple Choice)
4.8/5 (30)
Decide whether the lines are parallel perpendicular or neither.  and
and 
(Multiple Choice)
4.8/5 (40)
Determine whether the equation
 is linear. If it is linear put it into slope-intercept form.
(Essay)
4.9/5 (32)
The function  is a model for the number of cars allowed in a parking lot during a special event where t is measured in hours. What is the carrying capacity for the function f ?
(Multiple Choice)
4.8/5 (39)
When you graph a set of points on a coordinate plane the origin must always be in the center of the coordinate plane.
(True/False)
4.8/5 (32)
Decide whether you would graph the equation  by using the slope and y- intercept the x- and y -intercepts or by building a table of points to plot.
(Multiple Choice)
4.8/5 (31)
The model 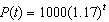 describes the amount of bacteria in a Petri dish after t hours. Which one of the following written statements best describes this population?
(Multiple Choice)
4.8/5 (35)
Using the following table of a function that models exponential decay determine which one of the following models the amount of radioactive substance as a function of time? 
(Multiple Choice)
4.9/5 (27)
Determine whether the following relation is a function.
For the year 2009 the input is the temperature at noon in degrees Fahrenheit and the output is the day of the year (1 to 365).
(Multiple Choice)
5.0/5 (30)
Use the graph to find the equation of the line. Put the answer in  form.
form. 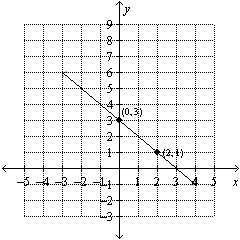
(Multiple Choice)
4.8/5 (41)
In 1990 a town's population was 21354. In 1998 the town's population increased to 29012. Assuming that the population increased exponentially the one-year growth factor is 1.039.
(True/False)
4.9/5 (37)
Filters
- Essay(0)
- Multiple Choice(0)
- Short Answer(0)
- True False(0)
- Matching(0)