Exam 3: Linear Equations With Two Variables
Exam 1: Building Blocks of Algebra379 Questions
Exam 2: Linear Equations and Inequalities With One Variable241 Questions
Exam 3: Linear Equations With Two Variables340 Questions
Exam 4: Systems of Linear Equations278 Questions
Exam 5: Exponents and Polynomials262 Questions
Exam 6: Factoring and Quadratic Equations288 Questions
Exam 7: Rational Expressions and Equations271 Questions
Exam 8: Radical Expressions and Equations237 Questions
Exam 9: Modeling Data74 Questions
Select questions type
Determine whether the following relation is a function.
The input is the number of children in the family and the output is the number of females in the family.
(Multiple Choice)
4.9/5  (35)
(35)
Atmospheric pressure (measured in atm) decreases by 11.5% for every 1000-meter increase in elevation. At sea level the atmospheric pressure is 1 atm. What is the 8000-meter decay factor for the atmospheric pressure (rounded to the nearest thousandth)?
(Multiple Choice)
4.9/5 (37)
The temperature increases from 6:00 A.M. onward. Let the input t represent the time of the day and let the output F represent the temperature in degrees Fahrenheit. At 6:00 A.M. (  ) the temperature is
  . At 1:00 P.M. (
  ) the temperature is
  . Find the linear relationship between t and F.
(Essay)
5.0/5 (41)
The number of people infected with the H1N1 virus as a function of time (in months) was originally modeled by  . Based on new data this model was updated to
  . What conclusions can be made based on the revised model?
(Multiple Choice)
4.8/5 (39)
Find the slope of the line that goes through the points  and
and  .
.
(Multiple Choice)
5.0/5 (39)
The number of ants in a colony at time t (in days) is modeled by 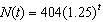 . What is the one-week growth factor for the number of ants (rounded to the nearest hundredth)?
(Multiple Choice)
4.9/5 (38)
Use the graph to find the equation of the line. Put the answer in  form.
form. 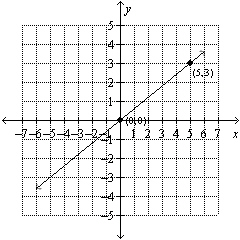
(Multiple Choice)
4.7/5 (28)
Find the equation of the line perpendicular to  passing through the point
  .
.
(Multiple Choice)
4.8/5 (34)
The number of bacteria present in a Petri dish at time t (in minutes) is modeled by 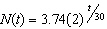 . Which one of the following models the population for a one-hour growth factor?
(Multiple Choice)
4.9/5 (32)
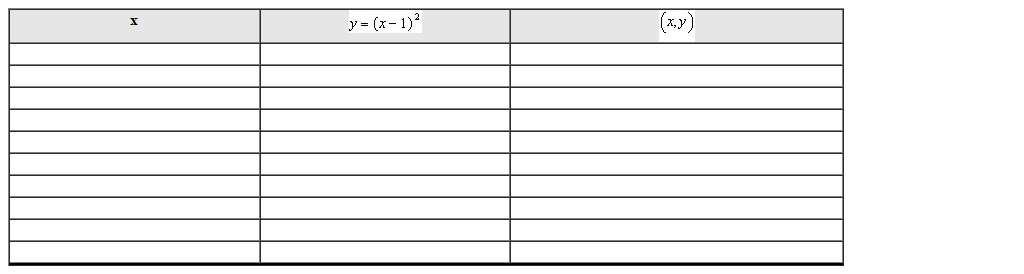
Use the equation to create a table of nine or more points and graph them. Connect the points with a smooth curve. Clearly label and scale the axes.
(Essay)
4.8/5 (31)
The amount of credit card debt that you have can be estimated by the equation  where D is credit card debt in dollars m months after you start paying off the credit card. Find and interpret the D- intercept for this equation.
(Multiple Choice)
4.8/5 (34)
The number of people infected with the H1N1 virus as a function of time (in months) was originally modeled by  . Based on new data this model was updated to
  . What conclusions can be made based on the revised model?
(Multiple Choice)
4.8/5 (33)
Filters
- Essay(0)
- Multiple Choice(0)
- Short Answer(0)
- True False(0)
- Matching(0)