Exam 3: Linear Equations With Two Variables
Exam 1: Building Blocks of Algebra379 Questions
Exam 2: Linear Equations and Inequalities With One Variable241 Questions
Exam 3: Linear Equations With Two Variables340 Questions
Exam 4: Systems of Linear Equations278 Questions
Exam 5: Exponents and Polynomials262 Questions
Exam 6: Factoring and Quadratic Equations288 Questions
Exam 7: Rational Expressions and Equations271 Questions
Exam 8: Radical Expressions and Equations237 Questions
Exam 9: Modeling Data74 Questions
Select questions type
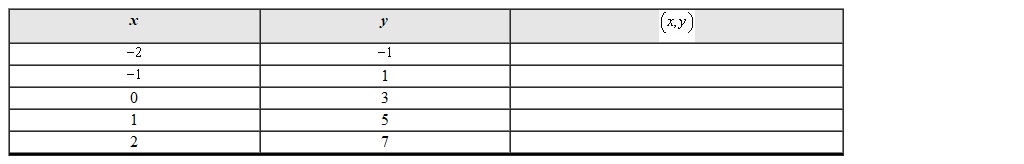
For the given input-output table complete the column to write coordinates for points. The equation is
(Essay)
4.8/5  (33)
(33)
Find the slope of the line that goes through the points  and
and  .
.
(Multiple Choice)
4.9/5 (38)
Determine the equation of the line that passes through the given points by using the point-slope form. Put the final answer in  form. Points:
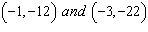
(Essay)
4.9/5 (33)
Find the slope of the line that goes through the points  and
and  .
.
(Multiple Choice)
4.8/5 (29)
In 1990 a town's population was 24382. In 1998 the town's population increased to 30608. Assuming that the population increased exponentially the population in 2006 was 38424.
(True/False)
4.7/5 (33)
Determine the equation of the line by using the point-slope form.  and point
(Multiple Choice)
4.8/5 (30)
When you graph a an ordered pair on the coordinate plane the first coordinate is the input value and the second coordinate is the output value.
(True/False)
4.8/5 (35)
Morphine is administered to a patient intravenously with an initial amount of 14 mg. About 26.7% of the morphine in a patient's body is metabolized and leaves the body each hour. Which one of the following models the amount of morphine remaining in the body for 1.5-hour periods of time?
(Multiple Choice)
4.8/5 (39)
To graph the given set of points in the input-output table a reasonable choice for the y scale is which value? 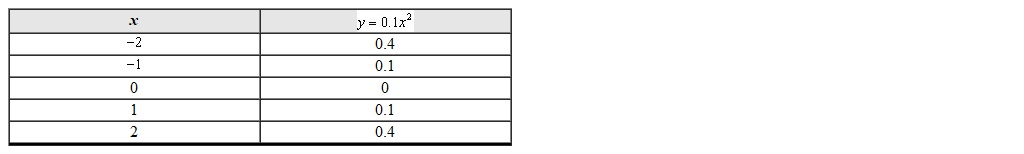
(Multiple Choice)
4.7/5 (27)
The function  is a model for a population A where t is measured in years. The function
 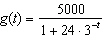 is a model for a population B where t is measured in years. What is the carrying capacity for the logistic function?
(Multiple Choice)
4.9/5 (36)
The graph of a function that models exponential growth is shown. What is the one-year growth factor? 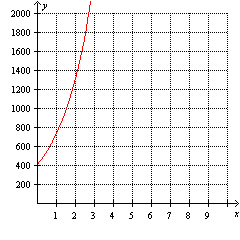
(Multiple Choice)
4.7/5 (33)
Determine whether the equation  is linear. If it is linear put it into slope-intercept form.
(Short Answer)
4.9/5 (35)
The value of an investment at time t (in months) is modeled by 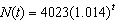 . What is the one-week growth factor for the value of the investment (rounded to the nearest ten-thousandths)?
(Multiple Choice)
4.7/5 (36)
Filters
- Essay(0)
- Multiple Choice(0)
- Short Answer(0)
- True False(0)
- Matching(0)