Exam 3: Linear Equations With Two Variables
Exam 1: Building Blocks of Algebra379 Questions
Exam 2: Linear Equations and Inequalities With One Variable241 Questions
Exam 3: Linear Equations With Two Variables340 Questions
Exam 4: Systems of Linear Equations278 Questions
Exam 5: Exponents and Polynomials262 Questions
Exam 6: Factoring and Quadratic Equations288 Questions
Exam 7: Rational Expressions and Equations271 Questions
Exam 8: Radical Expressions and Equations237 Questions
Exam 9: Modeling Data74 Questions
Select questions type
Determine the equation of the line that passes through the given points by using the point-slope form. Put the final answer in  form.
form.  and point
(Essay)
4.8/5  (26)
(26)
Find the equation of the line parallel to  passing through the point
  .
.
(Multiple Choice)
4.8/5 (40)
Decide whether the lines are parallel perpendicular or neither.  and
and 
(Multiple Choice)
4.7/5 (34)
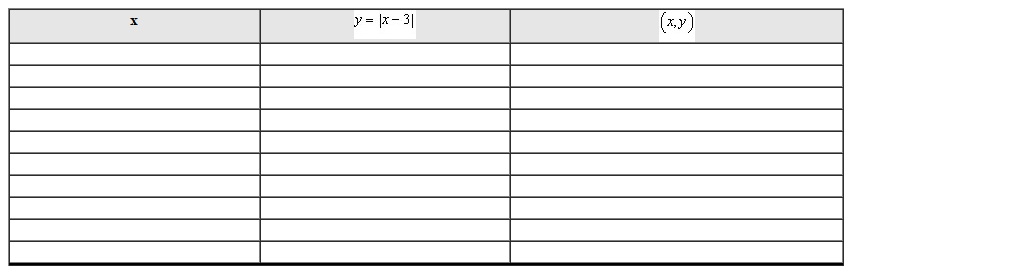
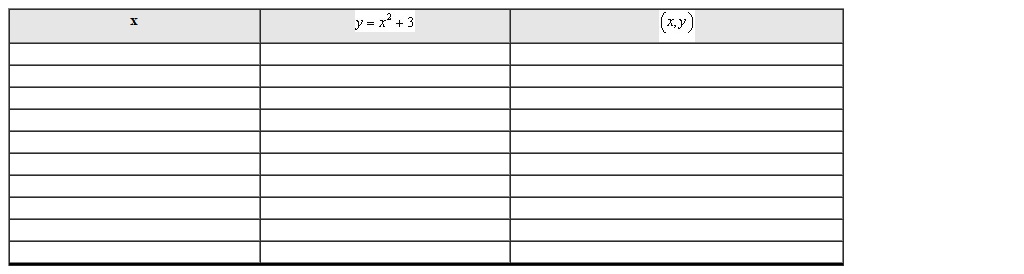
Use the equation to create a table of nine or more points and graph them. Connect the points with a smooth curve. Clearly label and scale the axes.
(Essay)
4.8/5 (29)
Use the graph to find the equation of the line. Put the answer in  form.
form. 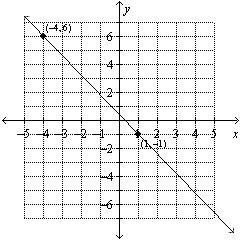
(Multiple Choice)
4.9/5 (33)
Find the slope of the line that goes through the points  and
and  .
.
(Short Answer)
4.7/5 (31)
Find the slope of the line that goes through the points  and
and  .
.
(Short Answer)
4.8/5 (31)
The number of tourists in a small town at time t (in years) is modeled by 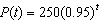 . What is the decay factor?
(Multiple Choice)
4.7/5 (25)
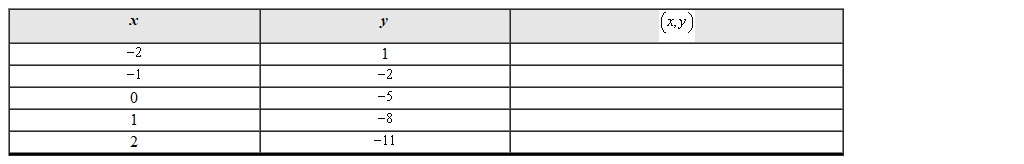
For the given input-output table complete the column to write coordinates for points. The equation is
(Essay)
4.8/5 (42)
Determine the equation of the line that passes through the given points. Put the final answer in  form. Points:
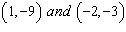
(Multiple Choice)
4.9/5 (25)
In the first year of her life your baby s height is estimated by the equation  where H is height in inches at age m months. a. Find and interpret the H- intercept for this equation. b. Find and interpret the m -intercept for this equation if it is meaningful. c. Find and interpret the slope for this equation.
(Essay)
4.9/5 (38)
Using the following table find the average rate of change in f from 0 to 2. 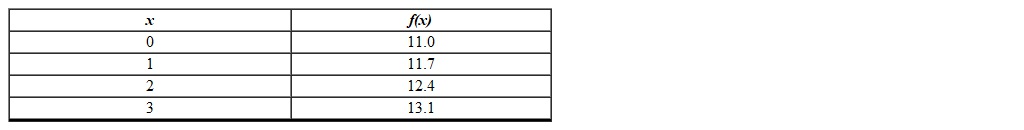
(Multiple Choice)
4.9/5 (35)
Use the equation to create a table of nine or more points and graph them. Connect the points with a smooth curve. Clearly label and scale the axes.
(Essay)
5.0/5 (30)
Graph the equation  using the slope and y- intercept. Graph at least three points. Clearly label and scale the axes.
(Essay)
4.8/5 (42)
Filters
- Essay(0)
- Multiple Choice(0)
- Short Answer(0)
- True False(0)
- Matching(0)