Exam 3: Linear Equations With Two Variables
Exam 1: Building Blocks of Algebra379 Questions
Exam 2: Linear Equations and Inequalities With One Variable241 Questions
Exam 3: Linear Equations With Two Variables340 Questions
Exam 4: Systems of Linear Equations278 Questions
Exam 5: Exponents and Polynomials262 Questions
Exam 6: Factoring and Quadratic Equations288 Questions
Exam 7: Rational Expressions and Equations271 Questions
Exam 8: Radical Expressions and Equations237 Questions
Exam 9: Modeling Data74 Questions
Select questions type
In 1990 a town's population was 22104. In 1998 the town's population increased to 31132. Assuming that the population increased exponentially the population in 1994 was 26618.
(True/False)
4.7/5  (33)
(33)
Determine whether the equation  is linear. If it is linear put it into slope-intercept form.
(Essay)
4.8/5 (36)
Determine whether the following relation is a function.
The input is the height of a patient in inches and the output is the weight of the patient in pounds.
(Multiple Choice)
4.8/5 (43)
A patient was administered Iodine-123 before a thyroid imaging scan. The table illustrates the data gathered over a 12-hour time period.
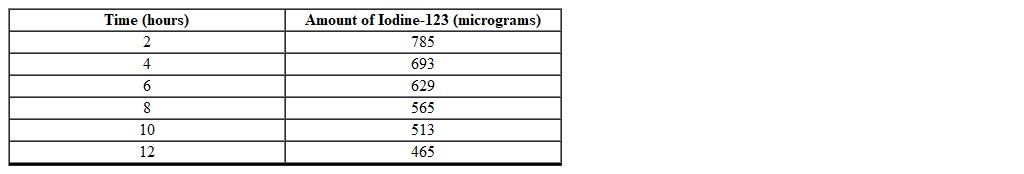 Using a graphing calculator find an appropriate curve that models the amount of Iodine-123 (in micrograms) as a function of the time (in hours) (round to the nearest thousandth).
(Essay)
4.9/5 (29)
The function  is a model for the number of cars allowed in a parking lot during a special event where t is measured in hours. What is the initial value for the function f ?
(Multiple Choice)
4.9/5 (30)
Find the slope of the line that goes through the points  and
and  .
.
(Short Answer)
4.9/5 (35)
Using the following table of a function that models exponential decay determine the one-month decay factor (rounded to the nearest thousandth). 
(Multiple Choice)
4.9/5 (33)
The population of Arizona was 5.1 million in 2000 and 7.7 million in 2008. If the population grew linearly which one of the following models the population as a function of time (in years since 2000)?
(Multiple Choice)
5.0/5 (36)
Using the following table of a function that models exponential decay determine the one-year decay factor (rounded to the nearest thousandth). 
(Multiple Choice)
4.8/5 (38)
Use the equation to create a table of nine or more points and graph them. Connect the points with a smooth curve. Clearly label and scale the axes.
(Essay)
4.8/5 (37)
Using the following table of a function that models exponential growth determine which one of the following models the population as a function of time. 
(Multiple Choice)
4.7/5 (38)
Which one of the following scenarios does NOT describe exponential growth?
(Multiple Choice)
4.9/5 (30)
Filters
- Essay(0)
- Multiple Choice(0)
- Short Answer(0)
- True False(0)
- Matching(0)