Exam 3: Linear Equations With Two Variables
Exam 1: Building Blocks of Algebra379 Questions
Exam 2: Linear Equations and Inequalities With One Variable241 Questions
Exam 3: Linear Equations With Two Variables340 Questions
Exam 4: Systems of Linear Equations278 Questions
Exam 5: Exponents and Polynomials262 Questions
Exam 6: Factoring and Quadratic Equations288 Questions
Exam 7: Rational Expressions and Equations271 Questions
Exam 8: Radical Expressions and Equations237 Questions
Exam 9: Modeling Data74 Questions
Select questions type
Determine the equation of the line that passes through the given points. Put the final answer in  form. Points:
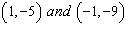
(Essay)
4.8/5  (31)
(31)
Decide whether you would graph the equation  by using the slope and y- intercept the x- and y -intercepts or by building a table of points to plot.
(Multiple Choice)
4.9/5 (36)
Atmospheric pressure (measured in atm) decreases by 11.5% for every 1000-meter increase in elevation. At sea level the atmospheric pressure is 1 atm. What is the atmospheric pressure at 8000 meters above sea level (rounded to the nearest thousandth)?
(Multiple Choice)
4.9/5 (33)
Sally wishes to invest $4500 in a 2-year CD with an interest rate of 5.3% each year and compounded monthly. What is the annual percentage yield for Sally's CD (rounded to the nearest hundredth)?
(Multiple Choice)
4.8/5 (41)
The revenue of a company is being monitored each month. The initial revenue is $1.3 million. The table illustrates the data gathered over a 6-month time period.
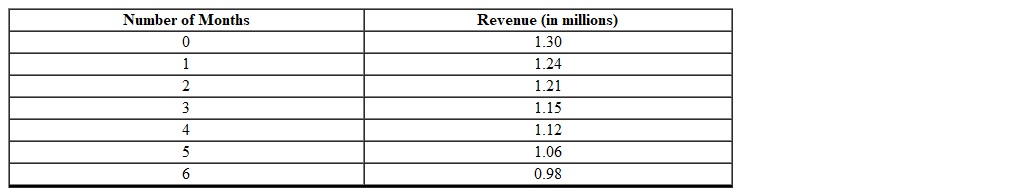 Using a graphing calculator find an appropriate curve that models the revenue as a function of the number of months (round to the nearest thousandth).
(Essay)
4.9/5 (27)
Using the following table of a function that models exponential decay determine the initial value (rounded to the nearest integer). 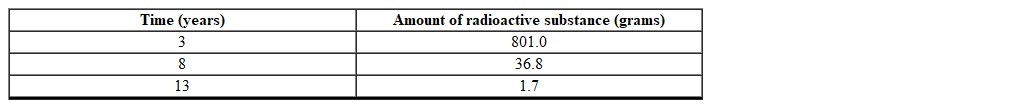
(Multiple Choice)
4.8/5 (27)
Graph the equation  using the slope and y- intercept. Graph at least three points. Clearly label and scale the axes.
(Essay)
4.8/5 (36)
The number of ants in a colony at time t (in days) is modeled by 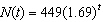 . How many ants will be in the colony after 6 days (rounded to the nearest integer)?
(Multiple Choice)
4.8/5 (34)
Graph the equation  using the slope and y- intercept. Graph at least three points. Clearly label and scale the axes.
(Essay)
4.8/5 (39)
The function 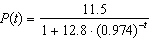 is a model for the world population (in billions) where t measures the number of years since 1900. What is the carrying capacity for the function P ?
(Multiple Choice)
4.8/5 (28)
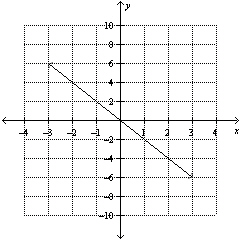
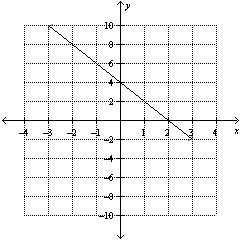
Use the graph to find the equation of the line. Put the answer in  form.
form. 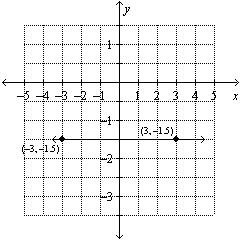
(Essay)
4.9/5 (29)
The slope of a line increases as you read the graph from left to right.
(True/False)
4.8/5 (31)
A town starts with 100 people and grows by 9% per year with x representing the number of years. Which of the following functions model this behavior?
(Multiple Choice)
4.8/5 (27)
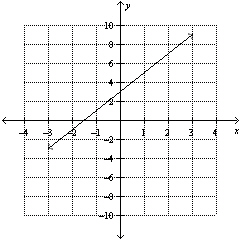
Match each graph to its linear equation.


Correct Answer: Verified
Premises:
Responses:


(Matching)
4.8/5 (29)
Filters
- Essay(0)
- Multiple Choice(0)
- Short Answer(0)
- True False(0)
- Matching(0)