Exam 15: Comparing Means of More Than Two Groups
Exam 1: Statistics and Samples36 Questions
Exam 2: Displaying Data55 Questions
Exam 3: Describing Data49 Questions
Exam 4: Estimating With Uncertainty47 Questions
Exam 5: Probability50 Questions
Exam 6: Hypothesis Testing40 Questions
Exam 7: Analyzing Proportions54 Questions
Exam 8: Fitting Probability Models to Frequency Data53 Questions
Exam 9: Contingency Analysis: Associations Between56 Questions
Exam 10: The Normal Distribution51 Questions
Exam 11: Inference for a Normal Population46 Questions
Exam 12: Comparing Two Means53 Questions
Exam 13: Handling Violations of Assumptions38 Questions
Exam 14: Designing Experiments56 Questions
Exam 15: Comparing Means of More Than Two Groups54 Questions
Exam 16: Correlation Between Numerical Variables49 Questions
Exam 17: Regression54 Questions
Exam 18: Multiple Explanatory Variables47 Questions
Exam 19: Computer-Intensive Methods25 Questions
Exam 20: Likelihood33 Questions
Exam 21: Meta-Analysis: Combining Information From38 Questions
Select questions type
A study examining the heights of single individuals from each of a series of families based on whether the family was vegetarian or not would be analyzed using a random-effects ANOVA.
Free
(True/False)
4.9/5  (35)
(35)
Correct Answer: Verified
False
Consider the data table shown with values for five individuals measured in each of four groups (A, B, C, and D). We will conduct an ANOVA analysis of this.
Groups A B C D 6 7 9 11 8 10 11 14 10 11 12 15 12 12 13 16 14 15 15 19
-To test the significance of the F-ratio value, what degrees of freedom would we use?
Free
(Multiple Choice)
4.9/5 (31)
Correct Answer:Verified
B
An experimental mistake is always equivalent to either a Type I or Type II error.
Free
(True/False)
4.9/5 (35)
Correct Answer:Verified
False
When studying randomly chosen groups, we don't tend to do which of the following?
(Multiple Choice)
4.9/5 (45)
When using the Tukey-Kramer method, the P-value is exact when the sample sizes in all groups are the same.
(True/False)
4.8/5 (30)
Based on the ANOVA table shown, what is the value for this data?
?
Source of Sum of Mean variation squares df squares F-ratio Groups 406 7 58 5.27 Error 704 64 11 Total 1,110 71 ?
(Multiple Choice)
4.8/5 (38)
Consider the data table shown with values for six individuals measured in each of four groups (A, B, C, and D). We will conduct an ANOVA analysis of this.
Groups A B C D 11 12 11 16 12 13 14 18 14 14 15 19 15 17 16 23
-What is the SSerror?
(Multiple Choice)
4.8/5 (33)
Consider the data table shown with values for five individuals measured in each of four groups (A, B, C, and D). We will conduct an ANOVA analysis of this.
Groups A B C D 6 7 9 11 8 10 11 14 10 11 12 15 12 12 13 16 14 15 15 19
-What is the SSgroups?
(Multiple Choice)
4.8/5 (37)
Consider the data table shown with values for five individuals measured in each of four groups (A, B, C, and D). We will conduct an ANOVA analysis of this.
Groups A B C D 6 7 9 11 8 10 11 14 10 11 12 15 12 12 13 16 14 15 15 19
-What is the SSerror?
(Multiple Choice)
4.8/5 (45)
Using the data set shown, calculate all the values you need to complete an ANOVA table.
Groups A B C D 14 14 14 15 15 16 17 17 17 17 18 18 18 21 19 22 Source of Sum of Mean variation squares df squares F-ratio Groups --- --- --- --- Error --- --- --- Total ---
(Essay)
4.9/5 (39)
The repeatability measures the overall similarity of repeat measurements made on the same group.
(True/False)
4.8/5 (35)
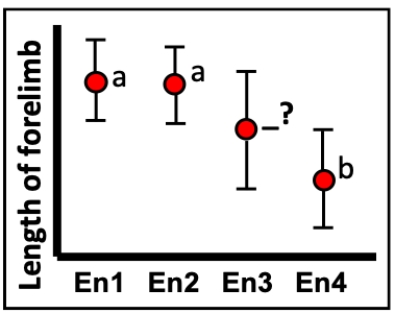
Consider the figure showing the results of a Tukey-Kramer procedure on the means of individuals collected from four different environments. If the bars represent 95% confidence intervals, what letter or combination of letters would the blank have?
(Multiple Choice)
4.9/5 (33)
Consider the data table shown with values for six individuals measured in each of four groups (A, B, C, and D). We will conduct an ANOVA analysis of this.
Groups A B C D 11 12 11 16 12 13 14 18 14 14 15 19 15 17 16 23
-What is the error mean square?
(Multiple Choice)
4.9/5 (25)
The ANOVA techniques is robust to violations of its assumptions when sample sizes are large.
(True/False)
4.7/5 (39)
Planned comparisons are slightly more robust to violations of the assumptions of the ANOVA than the ANOVA they follow.
(True/False)
4.9/5 (45)
Consider the data table shown with values for six individuals measured in each of four groups (A, B, C, and D). We will conduct an ANOVA analysis of this.
Groups A B C D 11 12 11 16 12 13 14 18 14 14 15 19 15 17 16 23
-What are the means of the groups and overall mean?
(Multiple Choice)
4.9/5 (35)
Usually for an ANOVA the variances in all the groups should be the same, but when can this assumption be relaxed?
(Multiple Choice)
4.7/5 (42)
In an ANOVA analysis, the R2 is likely to be larger when the P-value is smaller and vice-versa.
(True/False)
4.8/5 (34)
Filters
- Essay(0)
- Multiple Choice(0)
- Short Answer(0)
- True False(0)
- Matching(0)