Exam 15: Comparing Means of More Than Two Groups
Exam 1: Statistics and Samples36 Questions
Exam 2: Displaying Data55 Questions
Exam 3: Describing Data49 Questions
Exam 4: Estimating With Uncertainty47 Questions
Exam 5: Probability50 Questions
Exam 6: Hypothesis Testing40 Questions
Exam 7: Analyzing Proportions54 Questions
Exam 8: Fitting Probability Models to Frequency Data53 Questions
Exam 9: Contingency Analysis: Associations Between56 Questions
Exam 10: The Normal Distribution51 Questions
Exam 11: Inference for a Normal Population46 Questions
Exam 12: Comparing Two Means53 Questions
Exam 13: Handling Violations of Assumptions38 Questions
Exam 14: Designing Experiments56 Questions
Exam 15: Comparing Means of More Than Two Groups54 Questions
Exam 16: Correlation Between Numerical Variables49 Questions
Exam 17: Regression54 Questions
Exam 18: Multiple Explanatory Variables47 Questions
Exam 19: Computer-Intensive Methods25 Questions
Exam 20: Likelihood33 Questions
Exam 21: Meta-Analysis: Combining Information From38 Questions
Select questions type
Consider the data table shown with values for five individuals measured in each of four groups (A, B, C, and D). We will conduct an ANOVA analysis of this.
Groups A B C D 6 7 9 11 8 10 11 14 10 11 12 15 12 12 13 16 14 15 15 19
-What is the group mean square?
(Multiple Choice)
4.8/5  (35)
(35)
In an ANOVA analysis, the R2 measures the total variation in the data.
(True/False)
4.8/5 (40)
Consider a study involving six populations from which we draw samples of 12 values each in which the group mean square is 426 and the error mean square is 1416.
Source of Sum of Mean variation squares df squares F-ratio Groups --- --- --- --- Error --- --- --- Total --- (a) Complete the ANOVA table.
(b) Does it appear that any of the population the samples are drawn from have means that differ from one another?
(Short Answer)
4.8/5 (40)
Consider the partially completed ANOVA table shown.
Source of Sum of Mean variation squares df squares F-ratio Groups 384 6 \ldots \ldots Error 676 98 \ldots Total 1,060 104
-How many values are in each group of the data set this is based on?
(Multiple Choice)
4.9/5 (36)
Which of the following best describes when we would reject the null hypothesis when doing an ANOVA analysis?
(Multiple Choice)
4.8/5 (46)
Using the data set shown, calculate all the values you need to complete the ANOVA table.
Groups A B C D 13 10 12 14 15 13 14 17 17 14 15 18 19 15 16 19 21 18 18 22 Source of Sum of Mean variation squares df squares F-ratio Groups --- --- --- --- Error --- --- --- Total ---
(Short Answer)
4.8/5 (41)
Planned comparisons after an ANOVA using the t-test procedure tend to have higher precisions than regular two-sample t-tests. Why is that?
(Multiple Choice)
4.9/5 (43)
Consider the data table shown with values for six individuals measured in each of four groups (A, B, C, and D). We will conduct an ANOVA analysis of this.
Groups A B C D 11 12 11 16 12 13 14 18 14 14 15 19 15 17 16 23
-Use your calculated F-ratio, the degrees of freedom, and your table of critical F values to make a conclusion for this test?
(Multiple Choice)
4.8/5 (36)
When using the Tukey-Kramer method, the probability of making a Type I error is α for each pairwise comparison made.
(True/False)
4.9/5 (38)
A planned comparison when doing an ANOVA must be specified before the analysis, never afterwards.
(True/False)
4.9/5 (37)
If groups are predefined and of interest themselves, the explanatory variable is called a(n) ____ effect, but if the groups are randomly sampled from a population of possible groups, the explanatory variable is called a(n) ____ effect.
(Multiple Choice)
4.8/5 (30)
Consider the figure showing the results of a Tukey-Kramer procedure on the means of individuals collected from four different environments. If the bars represent 95% confidence intervals, what letter or combination of letters would the blank have?
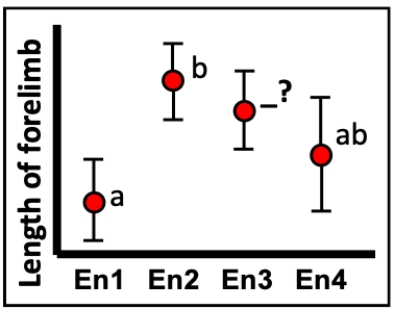
(Multiple Choice)
4.8/5 (43)
Use your calculated F-ratio, the degrees of freedom, and your table of critical F values to make a conclusion for this test?
(Multiple Choice)
4.8/5 (34)
Consider the data table shown with values for six individuals measured in each of four groups (A, B, C, and D). We will conduct an ANOVA analysis of this.
Groups A B C D 11 12 11 16 12 13 14 18 14 14 15 19 15 17 16 23
-What is the SSgroups?
(Multiple Choice)
4.8/5 (34)
Filters
- Essay(0)
- Multiple Choice(0)
- Short Answer(0)
- True False(0)
- Matching(0)