Exam 5: Time Series Analysis and Forecasting
Exam 1: Introduction30 Questions
Exam 2: Descriptive Statistics60 Questions
Exam 3: Data Visualization61 Questions
Exam 4: Linear Regression60 Questions
Exam 5: Time Series Analysis and Forecasting58 Questions
Exam 6: Data Mining60 Questions
Exam 7: Spreadsheet Models60 Questions
Exam 8: Linear Optimization Models60 Questions
Exam 9: Integer Linear Optimization Models60 Questions
Exam 10: Nonlinear Optimization Models60 Questions
Exam 11: Monte Carlo Simulation59 Questions
Exam 12: Decision Analysis60 Questions
Select questions type
Which of the following data patterns best describes the scenario shown in the given time series plot? 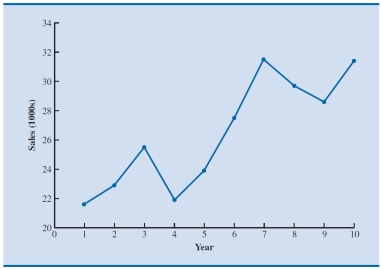
(Multiple Choice)
4.9/5  (43)
(43)
A _____ pattern exists when the data fluctuate randomly around a constant mean over time.
(Multiple Choice)
4.7/5 (46)
A causal model provides evidence of _____ between an independent variable and the variable to be forecast.
(Multiple Choice)
4.9/5 (34)
_____ uses a weighted average of past time series values as the forecast.
(Multiple Choice)
4.8/5 (37)
If the forecasted value of the time series variable for period 2 is 22.5 and the actual value observed for period 2 is 25, what is the forecast error in period 2?
(Multiple Choice)
4.8/5 (34)
The monthly market shares of General Electric Company for 12 consecutive months follow.
21.51, 22.43, 23.02, 23.03, 22.1, 23.37, 23.21, 24.6, 23.31, 23.94, 26.05, 26.65 a. Construct a time series plot. What type of pattern exists in the data?
b. Develop three-month and four-month moving averages for this time series. Does the three-month or the four-month moving average provide the better forecasts based on MSE? Explain.
c. What is the moving average forecast for the next month?
(Essay)
4.7/5 (39)
The process of _____ might be used to determine the value of smoothing constant that minimizes the mean squared error.
(Multiple Choice)
4.7/5 (35)
_____ is the term used for a time series whose statistical properties are independent of time.
(Multiple Choice)
4.8/5 (39)
Consider the following time series data:
 Using the average of all the historical data as a forecast for the next year, compute the following measures of forecast accuracy:a. Mean absolute error
b. Mean squared error
c. Mean absolute percentage error
d. What is the forecast for year 11?
Using the average of all the historical data as a forecast for the next year, compute the following measures of forecast accuracy:a. Mean absolute error
b. Mean squared error
c. Mean absolute percentage error
d. What is the forecast for year 11?
(Essay)
4.8/5 (34)
Which of the following data patterns best describes the scenario shown in the given time series plot? 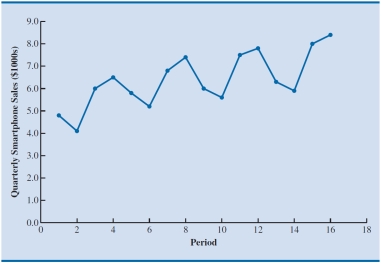
(Multiple Choice)
4.8/5 (47)
The exponential smoothing forecast for period t + 1 is a weighted average of the:
(Multiple Choice)
4.8/5 (34)
The moving averages method refers to a forecasting method that:
(Multiple Choice)
4.8/5 (31)
Consider the following time series data:
 a. Construct a time series plot. What type of pattern exists in the data?
b. Develop a three-year moving average for this time series. Compute MSE and a forecast for the year 11.
a. Construct a time series plot. What type of pattern exists in the data?
b. Develop a three-year moving average for this time series. Compute MSE and a forecast for the year 11.
(Essay)
4.9/5 (36)
The moving averages and exponential smoothing methods are appropriate for a time series exhibiting _____.
(Multiple Choice)
4.8/5 (37)
With reference to exponential forecasting models, a parameter that provides the weight given to the most recent time series value in the calculation of the forecast value is known as the _____.
(Multiple Choice)
4.9/5 (38)
The value of an independent variable from the prior period is referred to as a _____.
(Multiple Choice)
4.8/5 (30)
Filters
- Essay(0)
- Multiple Choice(0)
- Short Answer(0)
- True False(0)
- Matching(0)