Exam 9: Externalities and Public Goods
Exam 1: The Principles and Practice of Economics103 Questions
Exam 2: Economic Methods and Economic Questions94 Questions
Exam 3: Optimization: Doing the Best You Can94 Questions
Exam 4: Demand, supply, and Equilibrium185 Questions
Exam 5: Consumers and Incentives187 Questions
Exam 6: Sellers and Incentives261 Questions
Exam 7: Perfect Competition and the Invisible Hand251 Questions
Exam 8: Trade264 Questions
Exam 9: Externalities and Public Goods223 Questions
Exam 10: The Government in the Economy: Taxation and Regulation244 Questions
Exam 11: Markets for Factors of Production237 Questions
Exam 12: Monopoly295 Questions
Exam 13: Game Theory and Strategic Play199 Questions
Exam 14: Oligopoly and Monopolistic Competition264 Questions
Exam 15: Trade-Offs Involving Time and Risk147 Questions
Exam 16: The Economics of Information119 Questions
Exam 17: Auctions and Bargaining123 Questions
Exam 18: Social Economics111 Questions
Select questions type
The social cost of producing a good that generates negative externalities is the sum of the ________.
(Multiple Choice)
4.8/5  (29)
(29)
The following figure shows the private cost and social cost of producing Good X.
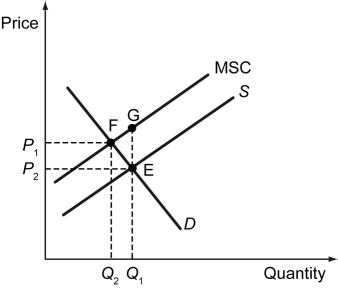 -Refer to the figure above.Total welfare can be increased by ________.
(Multiple Choice)
4.9/5 (34)
The total willingness to pay for public restrooms in a city is given in the table below.
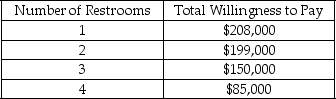 If the marginal cost of building a public restroom is $208,000,how many restrooms will be built?
(Multiple Choice)
5.0/5 (32)
Due to ongoing budget shortfalls,the city of Detroit has suspended services,such as street cleaning and maintenance of city-owned properties in several neighborhoods.In response,some homeowners in these neighborhoods sweep the streets,replace street lights,and mow the grass on city-owned lots.These actions by homeowners represent ________.
(Multiple Choice)
4.8/5 (43)
The government should provide an additional unit of a public good if ________.
(Multiple Choice)
4.9/5 (40)
The following figure shows the market supply and demand of a good whose production entails a $2 negative externality per unit.
 -Refer to the figure above.The total cost of this externality to the society is equal to ________.
(Multiple Choice)
4.8/5 (44)
The figure below shows the demand, supply, and marginal social benefit curves for Good Y.
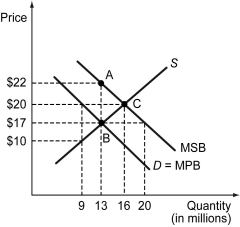 -Refer to the figure above.Social surplus can be increased by ________.
(Multiple Choice)
4.9/5 (41)
Which of the following happens when a Pigouvian subsidy is provided?
(Multiple Choice)
4.8/5 (37)
Cleanliness experts say that cleaning a house hygienically helps prevent the spread of germs in the area.What is the inefficiency created by not recognizing the linkage between cleaning the house and preventing the spread of germs? Explain with a suitable diagram.
(Essay)
4.8/5 (31)
The consumption of a good entails a $2 positive external benefit per unit.The following graph shows the market supply and demand of this good.Which of the dashed lines represents the marginal social benefit curve?

(Multiple Choice)
4.7/5 (38)
If the consumption of a good involves a positive externality,how can consumers be encouraged to consume more of the good?
(Essay)
4.9/5 (33)
A video available on a Web site that allows free download is a ________.
(Multiple Choice)
4.9/5 (44)
Scenario: A chemical factory is located upstream on a river. The factory dumps its liquid waste into the river. A microbrewery is located downstream on this river; it uses the river water in its production process and values the clean water. The chemical factory can filter its liquid waste before dumping it into the river, but it would be costly to the factory. The table below shows the profit to these two businesses under different circumstances.
 -Refer to scenario above.Could this externality problem be resolved by private negotiations between the chemical factory and the microbrewery?
(Multiple Choice)
4.9/5 (48)
The figure below shows the demand, supply, and marginal social benefit curves for Good Y.
-Refer to the figure above.The triangular region ABC represents the ________.
(Multiple Choice)
4.9/5 (41)
Which of the following occurs when an economic activity has a spillover benefit on third parties not engaged in the activity?
(Multiple Choice)
4.7/5 (28)
The tragedy of the commons occurs because some goods are ________ in consumption.
(Multiple Choice)
4.9/5 (38)
Which of the following is likely to give rise to a negative externality?
(Multiple Choice)
4.8/5 (29)
Filters
- Essay(0)
- Multiple Choice(0)
- Short Answer(0)
- True False(0)
- Matching(0)