Exam 9: Externalities and Public Goods
Exam 1: The Principles and Practice of Economics103 Questions
Exam 2: Economic Methods and Economic Questions94 Questions
Exam 3: Optimization: Doing the Best You Can94 Questions
Exam 4: Demand, supply, and Equilibrium185 Questions
Exam 5: Consumers and Incentives187 Questions
Exam 6: Sellers and Incentives261 Questions
Exam 7: Perfect Competition and the Invisible Hand251 Questions
Exam 8: Trade264 Questions
Exam 9: Externalities and Public Goods223 Questions
Exam 10: The Government in the Economy: Taxation and Regulation244 Questions
Exam 11: Markets for Factors of Production237 Questions
Exam 12: Monopoly295 Questions
Exam 13: Game Theory and Strategic Play199 Questions
Exam 14: Oligopoly and Monopolistic Competition264 Questions
Exam 15: Trade-Offs Involving Time and Risk147 Questions
Exam 16: The Economics of Information119 Questions
Exam 17: Auctions and Bargaining123 Questions
Exam 18: Social Economics111 Questions
Select questions type
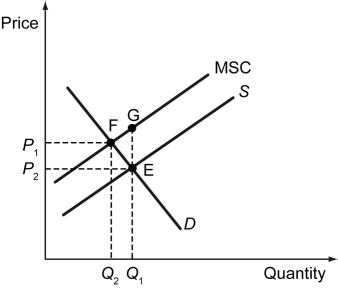
The following figure shows the private cost and social cost of producing Good X.
 -Refer to the figure above.Which of the following statements is true in this case?
(Multiple Choice)
4.9/5  (43)
(43)
When the production of a good involves negative externalities,the marginal social cost curve will most likely ________.
(Multiple Choice)
4.8/5 (36)
Explanation: The following figure graphs the answer.
 -Refer to the figure above.If Good X is a private good,what is the total quantity demanded on the market if the market price is $4?
(Multiple Choice)
4.9/5 (44)
The production of an industrial good in a plant emits harmful gases that cause breathing problems.Which of the following will happen if the government imposes a Pigouvian tax on the plant?
(Multiple Choice)
4.9/5 (38)
The figure below shows the demand, supply, and marginal social benefit curves for Good Y.
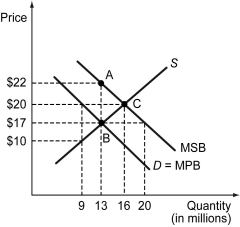 -Refer to the figure above.The MSB curve lies to the right of the demand curve because the production of Good Y involves ________.
(Multiple Choice)
4.7/5 (29)
The figure below shows the demand, supply, and marginal social benefit curves for Good Y.
-Refer to the figure above.The market price of Good Y is ________.
(Multiple Choice)
4.8/5 (36)
The following figure shows the private cost and social cost of producing Good X.
-Refer to the figure above.What does the region EFG represent?
(Multiple Choice)
4.8/5 (39)
Free access and unrestricted mining of iron ore led to the depletion of the iron ore deposits in Rockland.As a result,several economic activities were adversely affected.What caused the overexploitation of these resources when their conservation could have benefited the consumers in the economy?
(Essay)
4.9/5 (36)
________ occurs when an individual has no incentive to pay for a good because failure to pay does not prevent consumption.
(Multiple Choice)
5.0/5 (37)
Four roommates have moved into an apartment.However,none of them clean the apartment,thinking that the others will do it.This is an example of ________.
(Multiple Choice)
4.9/5 (33)
A corrective subsidy induces the ________ toward the socially optimal level.
(Multiple Choice)
4.9/5 (38)
Scenario: The production of a good creates a negative externality. The following figure shows the market for this good.
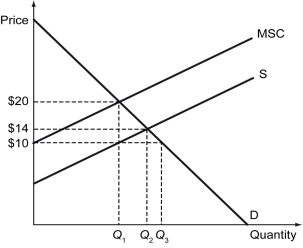 -Refer to the scenario above.The socially optimal price for this good is ________,while the market price of it is equal to ________.
(Multiple Choice)
4.7/5 (41)
Oil production by oil companies that use fracking can impose a ________ in the form of ________.
(Multiple Choice)
4.8/5 (36)
Which of the following is not a solution to the tragedy of the commons?
(Multiple Choice)
4.8/5 (32)
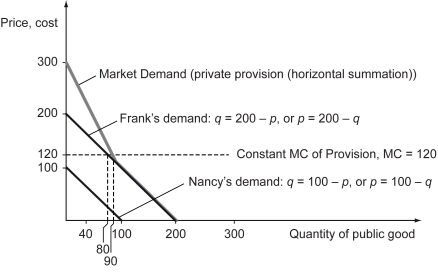
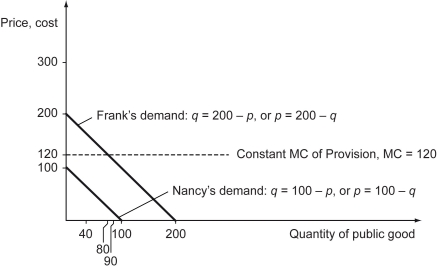
Scenario: Frank and Nancy live in a small community on Cape Cod in Massachusetts. For simplicity, assume Frank and Nancy are the only individuals in the community. Each has a demand for mosquito control, given by the following table, equations, and figure. Assume that mosquito control is a public good. Mosquito control is provided at a constant marginal cost of $120.
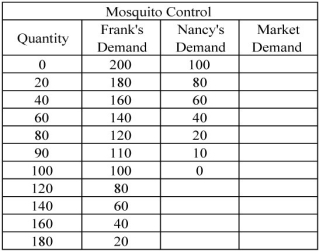 Frank's demand: qFᵣₐnk = 200 - p,
Frank's inverse demand = (Marginal Private Benefit): p = 200 - q,
Nancy's demand: qNₐncᵧ = 100 - p,
Nancy's inverse demand = (Marginal Private Benefit): p = 100 - q,
Frank's demand: qFᵣₐnk = 200 - p,
Frank's inverse demand = (Marginal Private Benefit): p = 200 - q,
Nancy's demand: qNₐncᵧ = 100 - p,
Nancy's inverse demand = (Marginal Private Benefit): p = 100 - q,
 -Refer to the scenario above.In the private market equilibrium,what are the quantities demanded of mosquito control for Frank and Nancy? Explain your answer.
(Multiple Choice)
4.8/5 (38)
Scenario: The following excerpt is from Michael A. McPherson and Michael L. Nieswiadomy, "African Elephants: The Effects of Property Rights and Political Stability," Contemporary Economic Policy 18, no. 1 (2007).
African elephant populations have declined by more than 50% over the past 20 years. International outrage over the slaughter led to a worldwide ban on ivory sales beginning in 1989, despite the objections of many economists and scientists, and of several southern African countries that have established systems of property rights over elephants. Far from declining, elephant populations in many of these countries have increased to levels at or above the carrying capacity of the ecosystem. This article estimates the determinants of changes in elephant populations in 35 African countries over several time periods. The authors find that, controlling for other factors, countries with property rights systems or community wildlife programs have more rapid elephant population growth rates than do those countries that do not. Political instability and the absence of representative governments significantly lower elephant growth rates.
-Refer to the scenario above.Which of the following is consistent with a solution to the elephant population decline described in the quote?
(Multiple Choice)
4.9/5 (32)
The following figure shows the market supply and demand of a good whose production entails a $2 negative externality per unit.
 -Refer to the figure above.A total of ________ units of this good will be traded in this market,at the price of ________.
(Multiple Choice)
4.9/5 (35)
Scenario: Vacant houses, foreclosed or abandoned, are typically boarded up with plywood that many people consider unsightly and likely to invite vandalism. An alternative is clear plastic (polycarbonate) panels. The figure below shows the demand and the supply of polycarbonate panels used for boarding up houses in a hypothetical town. To answer some of the questions below, it will be useful to find the equations of the three lines in the figure.
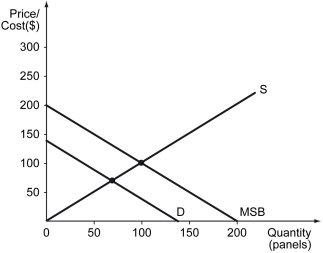 -Refer to the scenario above.For each additional polycarbonate panel generates ________ worth of social benefit beyond the private marginal benefit.
(Multiple Choice)
4.8/5 (38)
If the production of a chemical in a factory releases a harmful gas,how can the government maximize social well-being in the economy?
(Essay)
4.8/5 (31)
What constitutes evidence for the efficacy of the congestion charge described in the text?
(Multiple Choice)
4.8/5 (42)
Filters
- Essay(0)
- Multiple Choice(0)
- Short Answer(0)
- True False(0)
- Matching(0)