Exam 1: Getting Started
Exam 1: Getting Started337 Questions
Exam 2: The Usand Global Economies201 Questions
Exam 3: The Economic Problem273 Questions
Exam 4: Demand and Supply322 Questions
Exam 5: Elasticities of Demand and Supply335 Questions
Exam 6: Efficiency and Fairness of Markets352 Questions
Exam 7: Government Actions in Markets239 Questions
Exam 8: Taxes267 Questions
Exam 9: Global Markets in Action276 Questions
Exam 10: Externalities300 Questions
Exam 11: Public Goods and Common Resources177 Questions
Exam 12: Markets With Private Information101 Questions
Exam 13: Consumer Choice and Demand287 Questions
Exam 14: Production and Cost266 Questions
Exam 15: Perfect Competition275 Questions
Exam 16: Monopoly377 Questions
Exam 17: Monopolistic Competition213 Questions
Exam 18: Oligopoly222 Questions
Exam 19: Markets for Factors of Production178 Questions
Exam 20: Economic Inequality155 Questions
Select questions type
The cost of a one-unit increase in an activity is called the
Free
(Multiple Choice)
4.8/5  (29)
(29)
Correct Answer: Verified
C
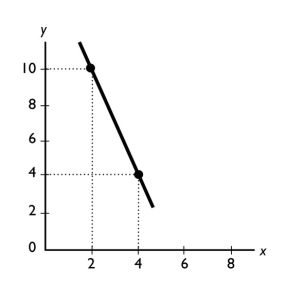 -The slope of the line shown in the above figure is
Free
(Multiple Choice)
4.9/5 (29)
Correct Answer:Verified
D
A graph shows the average wage of various demographic groups in 2012.The kind of graph used to show these data would be a
Free
(Multiple Choice)
4.9/5 (33)
Correct Answer:Verified
C
 -In the above figure,which of the figures show(s)a relationships between x and y with a positive slope?
(Multiple Choice)
4.7/5 (40)
The question "Should we produce houses using bricks or wood?" is an example of a ________ question.
(Multiple Choice)
4.9/5 (37)
Three variables are related and two of them are plotted in a figure.If the variable that is not measured on either the x-axis or the y-axis changes,then there is
(Multiple Choice)
4.8/5 (34)
"Lower ticket prices would lead to more people attending ballgames." This statement is a
(Multiple Choice)
4.9/5 (34)
A straight line falls when moving rightward along it.Hence the slope of the line is
(Multiple Choice)
4.9/5 (35)
A professor changes the penalty for cheating on exams from getting a 0 on the exam to getting an F in the course.The professor has
(Multiple Choice)
4.8/5 (29)
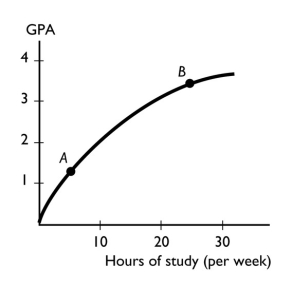
-The figure above shows the relationship between the time a student spends studying and the student's GPA that semester.This figure shows ________ relationship between the time spent studying and the GPA.
(Multiple Choice)
4.7/5 (31)
Congress and the President passed a national health care policy.This is an example of
(Multiple Choice)
4.9/5 (34)
In making your decision whether to take a trip during Spring Break,you compare all the other activities you could undertake.As a result,you
(Multiple Choice)
4.8/5 (35)
If the quantity of the variable on the y-axis increases by 10 when the quantity of the variable on the x-axis decreases by 2,then the slope of the curve equals
(Multiple Choice)
4.7/5 (27)
A graph has a point that is either a maximum or a minimum.To the left of the point,the slope of relationship is positive.To the right of the point,the slope is negative.Is the point a maximum point or a minimum point? Be sure to draw a figure that supports your answer.
(Essay)
4.9/5 (34)
Moving rightward along a straight line,the slope of the line
(Multiple Choice)
4.9/5 (31)
Which of the following is true?
i.A rational choice is made on the margin.
ii.Microeconomics is the study of the national economy while macroeconomics is the study of the global economy.
iii.Economists try to understand how the economic world works by testing normative statements.
(Multiple Choice)
4.9/5 (34)
Filters
- Essay(0)
- Multiple Choice(0)
- Short Answer(0)
- True False(0)
- Matching(0)