Exam 1: Getting Started
Exam 1: Getting Started337 Questions
Exam 2: The Usand Global Economies201 Questions
Exam 3: The Economic Problem273 Questions
Exam 4: Demand and Supply322 Questions
Exam 5: Elasticities of Demand and Supply335 Questions
Exam 6: Efficiency and Fairness of Markets352 Questions
Exam 7: Government Actions in Markets239 Questions
Exam 8: Taxes267 Questions
Exam 9: Global Markets in Action276 Questions
Exam 10: Externalities300 Questions
Exam 11: Public Goods and Common Resources177 Questions
Exam 12: Markets With Private Information101 Questions
Exam 13: Consumer Choice and Demand287 Questions
Exam 14: Production and Cost266 Questions
Exam 15: Perfect Competition275 Questions
Exam 16: Monopoly377 Questions
Exam 17: Monopolistic Competition213 Questions
Exam 18: Oligopoly222 Questions
Exam 19: Markets for Factors of Production178 Questions
Exam 20: Economic Inequality155 Questions
Select questions type
Amy can study for an hour or spend that hour sleeping or going out for dinner.If she decides to study for the hour,the opportunity cost of the hour spent studying is
(Multiple Choice)
4.8/5  (40)
(40)
What is the difference between a positive and a negative relationship?
(Essay)
4.8/5 (35)
The decision to go to graduate school is a rational one for a college student if the
(Multiple Choice)
4.9/5 (34)
A time-series graph displays the price of gold.The slope of the line is negative for periods when the
(Multiple Choice)
4.7/5 (41)
Suppose you decide to attend summer school and that this is considered a rational choice.When making this choice,
(Multiple Choice)
4.7/5 (35)
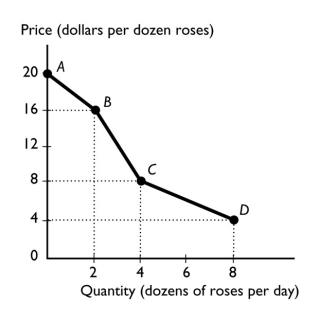 -The figure above shows the relationship between the price of a dozen roses and the quantity of roses a florist can sell.The slope between points A and B is
(Multiple Choice)
4.9/5 (38)
To graph a relationship involving more than two variables,we use which assumption?
(Multiple Choice)
4.9/5 (35)
A statement that "All children should receive free health care" is an example of what kind of statement?
(Multiple Choice)
4.8/5 (31)
To show the values of an economic variable for different groups in a population at a point in time,it is best to use a
(Multiple Choice)
4.8/5 (34)
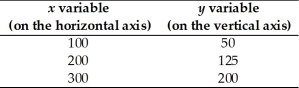 -The table above shows data on two variables.If these data were graphed,the slope of the line would be
(Multiple Choice)
4.8/5 (39)
On a graph showing the relationship between x and y,the ceteris paribus condition implies that
(Multiple Choice)
4.8/5 (39)
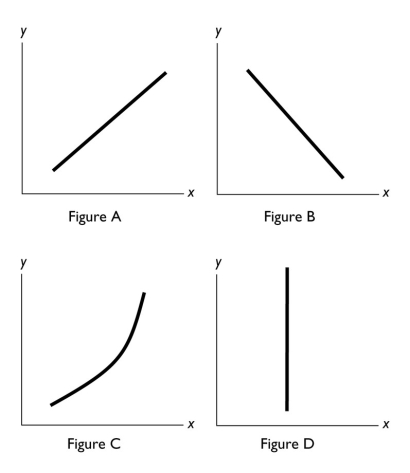 -In the above figure,no relationship between x and y is shown in Figure
(Multiple Choice)
4.9/5 (35)
Demonstrating how an economic variable changes from one year to the next is best illustrated by a
(Multiple Choice)
4.8/5 (33)
Filters
- Essay(0)
- Multiple Choice(0)
- Short Answer(0)
- True False(0)
- Matching(0)