Exam 1: Getting Started
Exam 1: Getting Started337 Questions
Exam 2: The Usand Global Economies201 Questions
Exam 3: The Economic Problem273 Questions
Exam 4: Demand and Supply322 Questions
Exam 5: Elasticities of Demand and Supply335 Questions
Exam 6: Efficiency and Fairness of Markets352 Questions
Exam 7: Government Actions in Markets239 Questions
Exam 8: Taxes267 Questions
Exam 9: Global Markets in Action276 Questions
Exam 10: Externalities300 Questions
Exam 11: Public Goods and Common Resources177 Questions
Exam 12: Markets With Private Information101 Questions
Exam 13: Consumer Choice and Demand287 Questions
Exam 14: Production and Cost266 Questions
Exam 15: Perfect Competition275 Questions
Exam 16: Monopoly377 Questions
Exam 17: Monopolistic Competition213 Questions
Exam 18: Oligopoly222 Questions
Exam 19: Markets for Factors of Production178 Questions
Exam 20: Economic Inequality155 Questions
Select questions type
In order to determine whether to major in economics,a rational individual compares the ________ of the decision.
(Multiple Choice)
4.9/5  (35)
(35)
Rather than go out to eat by yourself,you decide to stay at home and fix dinner for yourself and your two roommates.Your roommates applaud your decision.Your roommates tell you that your decision to eat at home has no opportunity cost because you already have all the dinner ingredients in your pantry.Is this comment correct?
(Essay)
4.9/5 (35)
Which of the following statements is the best example of the term ceteris paribus?
(Multiple Choice)
4.8/5 (31)
Proponents of cuts in income tax rates argue that when income tax rates are cut,workers have an incentive to increase their work hours.This argument is based on the assumption that
(Multiple Choice)
4.8/5 (36)
 -In the above figure,which of the figures shows a relationship between x and y with a negative slope?
(Multiple Choice)
4.7/5 (40)
Shaniq can spend the next hour studying for a finance test,hiking along the Oregon coast,watching reruns of Lost on television,or napping.If she decides to study,what is the opportunity cost of her choice: hiking,watching television,or napping?
(Essay)
4.9/5 (37)
A graph showing the values of an economic variable for different groups in a population at a point in time is called a
(Multiple Choice)
4.8/5 (37)
Suppose the relationship between a person's age and his or her height is plotted with the age measured along the x-axis and the height measured along the y-axis.Then,the curve showing this relationship is
(Multiple Choice)
4.7/5 (28)
When economists use the term "correlation," they are referring to
(Multiple Choice)
4.9/5 (35)
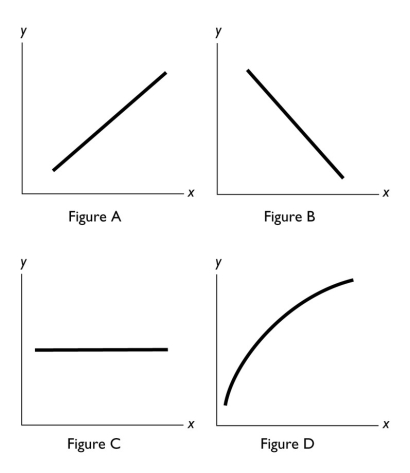 -In the above figure,a negative relationship between x and y is shown in Figure
(Multiple Choice)
5.0/5 (43)
As part of its proposal to win the 2012 Olympics,London developed a carbon offset plan to reduce the Games' impact on the environment.In 2011,the organizers decided to drop this plan to reduce emissions.We can conclude that
(Multiple Choice)
4.8/5 (45)
When a third string NFL quarterback earns more than a police officer,society answers the ________ question.
(Multiple Choice)
4.8/5 (37)
 -In the above,in which figure(s)is the slope the same at every point?
(Multiple Choice)
4.9/5 (45)
Which of the following is a microeconomic topic?
I.Gas prices increase after a hurricane hits the gulf coast.
II.Xavier starts a new business designing web pages.
III.Abby decides to practice an extra hour of soccer instead of studying.
(Multiple Choice)
4.8/5 (30)
If the quantity of the variable on the y-axis increases by 3 when the quantity of the variable on the x-axis increases by 4,then the slope of the curve equals
(Multiple Choice)
4.9/5 (33)
Filters
- Essay(0)
- Multiple Choice(0)
- Short Answer(0)
- True False(0)
- Matching(0)