Exam 1: Getting Started
Exam 1: Getting Started337 Questions
Exam 2: The Usand Global Economies201 Questions
Exam 3: The Economic Problem273 Questions
Exam 4: Demand and Supply322 Questions
Exam 5: Elasticities of Demand and Supply335 Questions
Exam 6: Efficiency and Fairness of Markets352 Questions
Exam 7: Government Actions in Markets239 Questions
Exam 8: Taxes267 Questions
Exam 9: Global Markets in Action276 Questions
Exam 10: Externalities300 Questions
Exam 11: Public Goods and Common Resources177 Questions
Exam 12: Markets With Private Information101 Questions
Exam 13: Consumer Choice and Demand287 Questions
Exam 14: Production and Cost266 Questions
Exam 15: Perfect Competition275 Questions
Exam 16: Monopoly377 Questions
Exam 17: Monopolistic Competition213 Questions
Exam 18: Oligopoly222 Questions
Exam 19: Markets for Factors of Production178 Questions
Exam 20: Economic Inequality155 Questions
Select questions type
Of the three major economic questions,which of the following is the best example of a "How?" question?
(Multiple Choice)
4.8/5  (33)
(33)
Increasing income tax rates will solve the "social security time bomb issue" is an example of
(Multiple Choice)
4.8/5 (40)
In economics,cost is measured as ________,and benefit is measured as ________.
(Multiple Choice)
4.8/5 (26)
Explain whether the statement "The government should increase tariffs on Japanese cars to protect the American car industry from competition," is a normative or positive statement.
(Essay)
4.9/5 (35)
A time series graph reveals whether there is a ________ ,which represents ________.
(Multiple Choice)
4.8/5 (41)
What are the two different types of relationships that variables can have? Explain each.What do these relationships look like when they are graphed?
(Essay)
4.8/5 (41)
As the price of home heating oil rises,families buy less home heating oil.Hence a scatter diagram with the price of home heating oil on the vertical axis and the quantity purchased on the horizontal axis reveals a ________ relationship.
(Multiple Choice)
4.8/5 (35)
"The change in the value of the variable measured on the y-axis divided by the change in the value of the variable measured on the x-axis" is the definition of
(Multiple Choice)
4.8/5 (48)
As a person increases his or her caloric intake,the person's weight increases,ceteris paribus.The relationship between the person's caloric intake and the person's weight is an example of
(Multiple Choice)
4.9/5 (32)
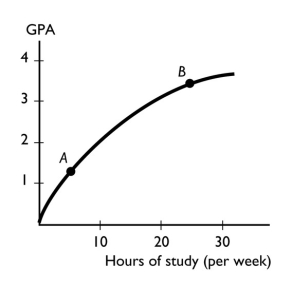 -The figure above shows the relationship between the time a student spends studying and the student's GPA that semester.The slope of the relationship at point A ________ the slope at point B.
(Multiple Choice)
4.9/5 (40)
Filters
- Essay(0)
- Multiple Choice(0)
- Short Answer(0)
- True False(0)
- Matching(0)