Exam 1: Getting Started
Exam 1: Getting Started337 Questions
Exam 2: The Usand Global Economies201 Questions
Exam 3: The Economic Problem273 Questions
Exam 4: Demand and Supply322 Questions
Exam 5: Elasticities of Demand and Supply335 Questions
Exam 6: Efficiency and Fairness of Markets352 Questions
Exam 7: Government Actions in Markets239 Questions
Exam 8: Taxes267 Questions
Exam 9: Global Markets in Action276 Questions
Exam 10: Externalities300 Questions
Exam 11: Public Goods and Common Resources177 Questions
Exam 12: Markets With Private Information101 Questions
Exam 13: Consumer Choice and Demand287 Questions
Exam 14: Production and Cost266 Questions
Exam 15: Perfect Competition275 Questions
Exam 16: Monopoly377 Questions
Exam 17: Monopolistic Competition213 Questions
Exam 18: Oligopoly222 Questions
Exam 19: Markets for Factors of Production178 Questions
Exam 20: Economic Inequality155 Questions
Select questions type
Your friend is preparing for this exam and in your practice session makes the following statement: "Instead of attending microeconomics class for two hours,Kiki could have played tennis or watched a movie.Therefore,the opportunity cost of attending class is the tennis and the movie she had to give up." Is your friend's analysis correct or not? Explain your answer.
(Essay)
4.8/5  (36)
(36)
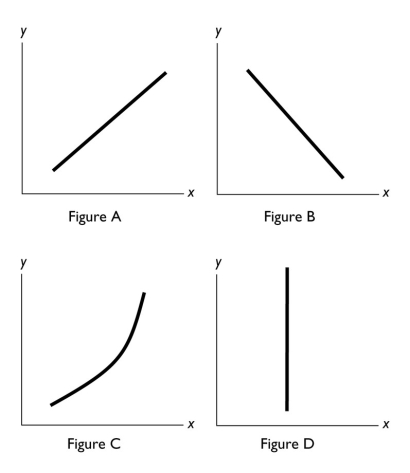 -In the diagram above,which figure(s)show(s)no relationship between the variables?
(Multiple Choice)
4.8/5 (41)
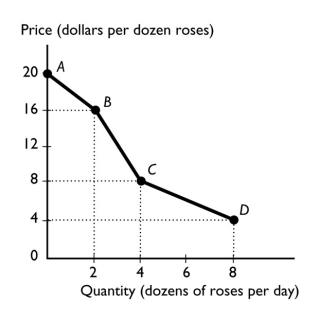 -The figure above shows the relationship between the price of a dozen roses and the quantity of roses a florist can sell.The slope between points C and D equals
(Multiple Choice)
4.7/5 (34)
When analyzing graphically the relationship between more than two variables,which of the following must be used?
(Multiple Choice)
4.8/5 (29)
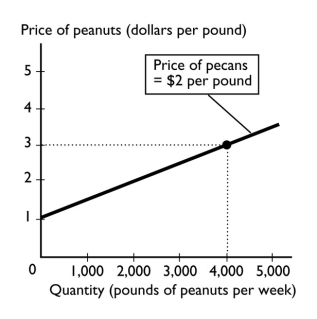 -The above figure shows how many pounds of peanuts farmers are willing to sell at different prices per pound of peanuts.If the price of a pound of peanuts is $1 and the price of a pound of pecans is $2,peanut farmers are willing to sell
(Multiple Choice)
4.8/5 (47)
To graph a relationship among several variables,we hold all but ________ variable(s)constant and use the ________ assumption.
(Multiple Choice)
4.8/5 (37)
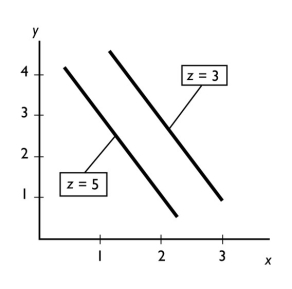 -In the figure above,ceteris paribus,an increase in x is associated with
(Multiple Choice)
4.8/5 (36)
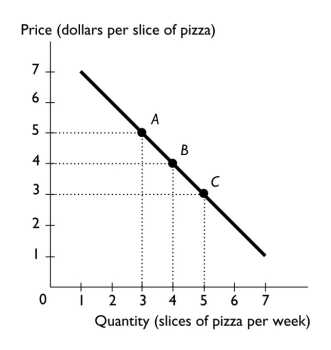 -The above figure shows the relationship between the price of a slice of pizza and how many slices of pizza Ricardo buys in a week.Between points A and B,the slope of the line is ________ the slope of the line between points B and C.
(Multiple Choice)
4.7/5 (40)
When the federal government decides to pay senators more than it pays soldiers,it answers the ________ question.
(Multiple Choice)
4.7/5 (40)
What typically happens to benefits as the amount of an activity is increased?
(Multiple Choice)
4.9/5 (33)
As the number of days without rain increases,the amount of wheat grown per acre declines.A graph showing this relationship shows
(Multiple Choice)
4.7/5 (42)
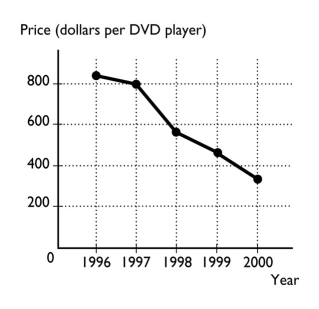 -The figure above shows the price of a DVD player from 1996 to 2000.
a.What type of graph is illustrated above?
b.What is the trend in the price of a DVD player?
-The figure above shows the price of a DVD player from 1996 to 2000.
a.What type of graph is illustrated above?
b.What is the trend in the price of a DVD player?
(Essay)
4.8/5 (41)
Filters
- Essay(0)
- Multiple Choice(0)
- Short Answer(0)
- True False(0)
- Matching(0)