Exam 1: Getting Started
Exam 1: Getting Started337 Questions
Exam 2: The Usand Global Economies201 Questions
Exam 3: The Economic Problem273 Questions
Exam 4: Demand and Supply322 Questions
Exam 5: Elasticities of Demand and Supply335 Questions
Exam 6: Efficiency and Fairness of Markets352 Questions
Exam 7: Government Actions in Markets239 Questions
Exam 8: Taxes267 Questions
Exam 9: Global Markets in Action276 Questions
Exam 10: Externalities300 Questions
Exam 11: Public Goods and Common Resources177 Questions
Exam 12: Markets With Private Information101 Questions
Exam 13: Consumer Choice and Demand287 Questions
Exam 14: Production and Cost266 Questions
Exam 15: Perfect Competition275 Questions
Exam 16: Monopoly377 Questions
Exam 17: Monopolistic Competition213 Questions
Exam 18: Oligopoly222 Questions
Exam 19: Markets for Factors of Production178 Questions
Exam 20: Economic Inequality155 Questions
Select questions type
Explain whether the statement,"There is life on Mars," is a normative or positive statement.
(Essay)
4.8/5  (39)
(39)
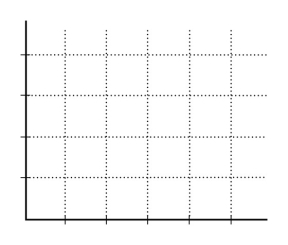
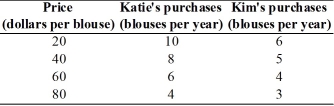 -The table above shows how many blouses Katie and Kim will purchase at different prices for a blouse.In the figure,label the axes and put the price on the y-axis and the quantity of blouses on the x-axis.Plot the data for Katie in the figure.Then,plot the data for Kim in the figure.
(Essay)
4.8/5 (29)
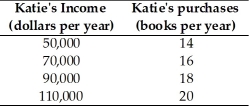 -The table above shows how the number of books Katie buys each year depends on her income
A)What kind of relationship exists between Katie's income and the number of books she purchases?
-The table above shows how the number of books Katie buys each year depends on her income
A)What kind of relationship exists between Katie's income and the number of books she purchases?
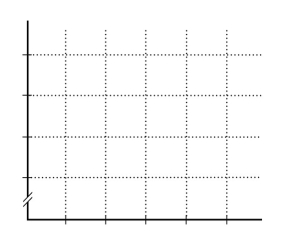 B)Plot the relationship between Katie's income and the number of books she purchases in the above figure.Measure income along the vertical axis and the number of books along the horizontal axis.Be sure to label the axes.
C)What is the slope of the relationship between $50,000 and $70,000 of income?
D)What is the slope of the relationship between $90,000 and $110,000 of income?
E)Comment on the similarity or dissimilarity of your answers to parts (c)and (d).
B)Plot the relationship between Katie's income and the number of books she purchases in the above figure.Measure income along the vertical axis and the number of books along the horizontal axis.Be sure to label the axes.
C)What is the slope of the relationship between $50,000 and $70,000 of income?
D)What is the slope of the relationship between $90,000 and $110,000 of income?
E)Comment on the similarity or dissimilarity of your answers to parts (c)and (d).
(Essay)
4.9/5 (40)
If x increases and as a result y decreases,then x and y are
(Multiple Choice)
4.8/5 (36)
When Delta decides to quit flying to Lithuania,it directly answers the ________ question.
(Multiple Choice)
4.8/5 (42)
With y measured on the vertical axis and x measured on the horizontal axis,the slope of a straight line is defined as
(Multiple Choice)
4.9/5 (41)
Will,Bill,and Phil decide to study an extra hour for an exam.Instead of studying,they could have gone out to eat,played football,or watched TV.Which of the following statements is correct?
(Multiple Choice)
4.8/5 (32)
If whenever one variable increases,another variable also increases,then these two variables are ________ related.
(Multiple Choice)
4.8/5 (34)
If Jessie studies economics for two hours instead of going to the movies with her friends,then
(Multiple Choice)
4.7/5 (32)
Which of the following is NOT a normative economic statement?
(Multiple Choice)
4.8/5 (38)
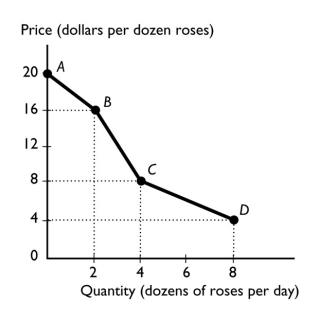 -The figure above shows the relationship between the price of a dozen roses and the quantity of roses a florist can sell.The relationship between the price and the quantity the florist can sell is
(Multiple Choice)
4.9/5 (42)
Must a rational choice always work out well? In other words,is it possible for someone to regret a rational decision?
(Essay)
4.9/5 (29)
Filters
- Essay(0)
- Multiple Choice(0)
- Short Answer(0)
- True False(0)
- Matching(0)