Exam 1: Getting Started
Exam 1: Getting Started337 Questions
Exam 2: The Usand Global Economies201 Questions
Exam 3: The Economic Problem273 Questions
Exam 4: Demand and Supply322 Questions
Exam 5: Elasticities of Demand and Supply335 Questions
Exam 6: Efficiency and Fairness of Markets352 Questions
Exam 7: Government Actions in Markets239 Questions
Exam 8: Taxes267 Questions
Exam 9: Global Markets in Action276 Questions
Exam 10: Externalities300 Questions
Exam 11: Public Goods and Common Resources177 Questions
Exam 12: Markets With Private Information101 Questions
Exam 13: Consumer Choice and Demand287 Questions
Exam 14: Production and Cost266 Questions
Exam 15: Perfect Competition275 Questions
Exam 16: Monopoly377 Questions
Exam 17: Monopolistic Competition213 Questions
Exam 18: Oligopoly222 Questions
Exam 19: Markets for Factors of Production178 Questions
Exam 20: Economic Inequality155 Questions
Select questions type
Two variables are unrelated if their graph is
i.a vertical line.
ii.a 45 degree line.
iii.a horizontal line.
(Multiple Choice)
4.9/5  (34)
(34)
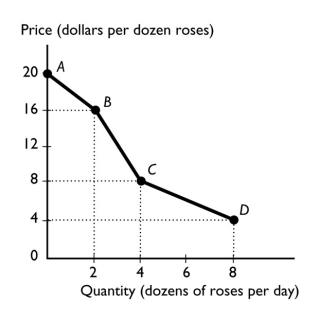 -The figure above shows the relationship between the price of a dozen roses and the quantity of roses a florist can sell.The slope between points B and C equals
(Multiple Choice)
4.7/5 (32)
Mothers Against Drunk Drivers (MADD)campaigned to increase the legal penalties of drunk driving.This successful campaign ________ of drunk driving.
(Multiple Choice)
4.9/5 (34)
Canada has nationalized health care,so that everyone,regardless of their ability to pay,has some access to health care.Based on this observation,Canada has decided that "everyone,regardless of their ability to pay" is the answer to what microeconomic question?
(Multiple Choice)
4.7/5 (40)
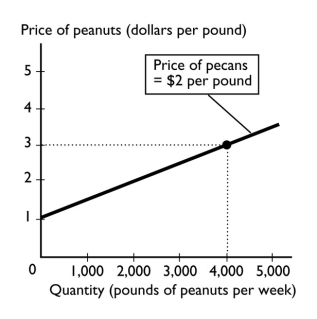 -In the figure above,suppose the price of a pound of pecans is negatively related to the quantity of peanuts that farmers are willing to supply.If the price of pecans increases,
(Multiple Choice)
4.8/5 (28)
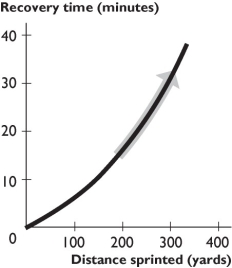 -The figure above shows the relationship between distance sprinted and recovery time.The curve becomes steeper because as the distance sprinted increases,
(Multiple Choice)
4.8/5 (38)
We are investigating the relationship among three variables.We have graphed two of them.Suppose that the variable that is not measured on the x-axis or the y-axis changes.Then,there is
(Multiple Choice)
4.8/5 (40)
The statement that "increases in the tax on gasoline increase the price of gasoline" is an example of a
(Multiple Choice)
4.8/5 (35)
A graph shows the price of a pound of cucumbers on the vertical axis and the quantity of new cars sold by Honda on the horizontal axis.The price of a pound of cucumbers remains constant as the quantity of new cars sold increases.The graph of these data is a
(Multiple Choice)
4.8/5 (34)
Which of the following is true regarding a normative statement?
i.It uses the ceteris paribus assumption.
ii.It is a value judgment.
iii.It accounts for opportunity costs.
(Multiple Choice)
4.9/5 (38)
A graph shows the wage rate of factory workers.The slope of the line is positive for periods when the wage rate is
(Multiple Choice)
4.8/5 (44)
Of the three major economic questions,which of the following is the best example of a "What?" question?
(Multiple Choice)
4.9/5 (44)
Going skiing will cost Adam $80 a day.He also loses $40 per day in wages because he has to take time off from work.Adam still decides to go skiing.
(Multiple Choice)
4.7/5 (25)
Filters
- Essay(0)
- Multiple Choice(0)
- Short Answer(0)
- True False(0)
- Matching(0)