Exam 1: Getting Started
Exam 1: Getting Started337 Questions
Exam 2: The Usand Global Economies201 Questions
Exam 3: The Economic Problem273 Questions
Exam 4: Demand and Supply322 Questions
Exam 5: Elasticities of Demand and Supply335 Questions
Exam 6: Efficiency and Fairness of Markets352 Questions
Exam 7: Government Actions in Markets239 Questions
Exam 8: Taxes267 Questions
Exam 9: Global Markets in Action276 Questions
Exam 10: Externalities300 Questions
Exam 11: Public Goods and Common Resources177 Questions
Exam 12: Markets With Private Information101 Questions
Exam 13: Consumer Choice and Demand287 Questions
Exam 14: Production and Cost266 Questions
Exam 15: Perfect Competition275 Questions
Exam 16: Monopoly377 Questions
Exam 17: Monopolistic Competition213 Questions
Exam 18: Oligopoly222 Questions
Exam 19: Markets for Factors of Production178 Questions
Exam 20: Economic Inequality155 Questions
Select questions type
List and explain the three fundamental economic questions that must be answered by all economic systems.
(Essay)
4.9/5  (36)
(36)
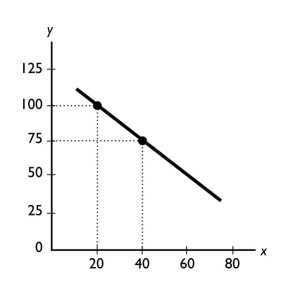 -The figure above shows the relationship between the time a student spends studying and the student's GPA that semester.The slope of the relationship at point A equals
(Multiple Choice)
4.7/5 (40)
Explain whether the statement,"Hillary Clinton was elected President of the United States in 2008," is a normative or positive statement.
(Essay)
4.9/5 (41)
Why is the benefit of something measured by what you are willing to give up?
(Essay)
4.9/5 (41)
Pumpkins are grown in New Mexico with the aid of fertilizer.Hence,fertilizer is a partial answer to which of the three economic question?
(Essay)
4.7/5 (38)
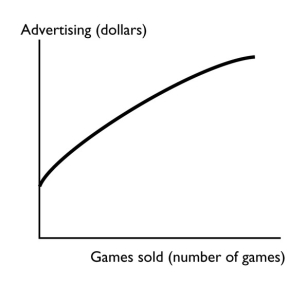 -The figure above shows how the sales of the video game "Tomb Raider-Lara Retires" change when the advertising spent on the game changes.Is the relationship between advertising and the number of games sold positive,negative,or neither? Explain your answer.
(Essay)
4.8/5 (37)
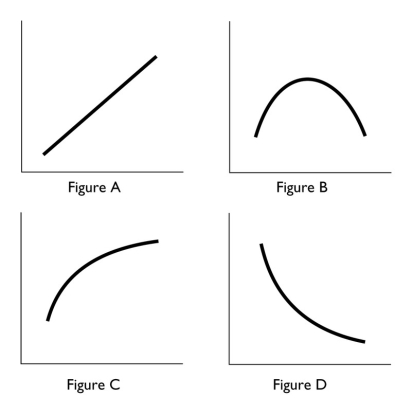 -In the above,which figure(s)show a relationship between the variables that is always negative?
(Multiple Choice)
4.8/5 (37)
Whether a company produces fishing rods mostly by hand or using high-tech machinery is a question of
(Multiple Choice)
4.9/5 (37)
You have data for sales of pizza for each of the 50 states in 2011.The type of graph to best display these data would be a
(Multiple Choice)
4.8/5 (36)
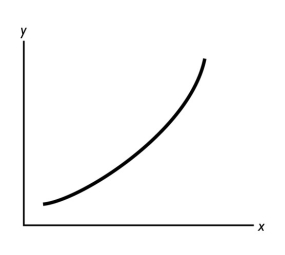 -In the figure above,what can you deduce about the slope of the curve?
(Essay)
4.9/5 (39)
Consider a diagram in which the variable measured on the y-axis remains constant while the variable measured on the x-axis increases.The graph of these two variables is a
(Multiple Choice)
4.7/5 (42)
A graph shows the average SAT scores for males and females in 2012.The kind of graph used to show these data would be a
(Multiple Choice)
4.9/5 (40)
Filters
- Essay(0)
- Multiple Choice(0)
- Short Answer(0)
- True False(0)
- Matching(0)