Exam 13: Supplement: Statistical Quality Control and Six Sigma Quality Management
Exam 1: Operations Management, Processes, and Supply Chain Management41 Questions
Exam 2: Corporate Strategy, Performance, and Sustainability55 Questions
Exam 3: Product Design and Development50 Questions
Exam 4: Process Design and Capacity Management48 Questions
Exam 5: Customer Relationships and Customer Service50 Questions
Exam 6: Demand Management, Forecasting, and Aggregate Planning45 Questions
Exam 7: Independent Demand Inventory Management45 Questions
Exam 8: Supplement: Job Scheduling and Vehicle Routing and Material Flow Analysis and Facility Layouts93 Questions
Exam 9: Lean Systems50 Questions
Exam 10: Managing Customer and Work Flows50 Questions
Exam 11: Managing Information Flowsmrp and ERP46 Questions
Exam 12: Managing Projects42 Questions
Exam 13: Supplement: Statistical Quality Control and Six Sigma Quality Management97 Questions
Exam 14: Supply Chain Processes50 Questions
Exam 15: Location, Logistics, and Product Returns49 Questions
Exam 16: Integrating Processes Along the Supply Chain42 Questions
Select questions type
Over a 10-day period, an outdoor light post manufacturer has counted the number of units not meeting design specifications. The findings are shown below.
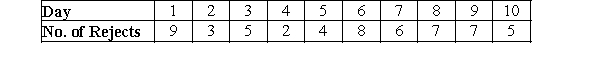 -Calculate the sample standard deviation for the C chart
(Multiple Choice)
4.8/5  (35)
(35)
A company currently produced 750,000 units, with a total defect level of 6,300. Each unit has a potential of 300 defects.
-When the percentage of defect-free output is 99.9968, the defects per million opportunities is _______.
(Multiple Choice)
4.8/5 (32)
Number of defects = 4,795; opportunities for a defect to occur = 315; number of units = 1,650,000
-What will be your best choice for the Six Sigma operating level?
(Multiple Choice)
4.8/5 (41)
A company currently produced 750,000 units, with a total defect level of 6,300. Each unit has a potential of 300 defects.
-When defects per million opportunities (DPMO) is 233, the sigma level is _______.
(Multiple Choice)
4.9/5 (36)
Number of defects = 750; opportunities for a defect to occur = 5; number of units = 16,000
-Calculate the defects per million opportunities, DPMO.
(Multiple Choice)
4.9/5 (38)
A firm recently produced 7,778 units, with a total defect level of 90. Each unit can have 32 defects.
-What is the firm's probable DPMO?
(Multiple Choice)
4.8/5 (39)
Number of defects = 350; opportunities for a defect to occur = 10; number of units = 1,000
-To achieve a sigma level of 4.5, what would be the number of defects?
(Multiple Choice)
4.8/5 (29)
Sample means and ranges were obtained for five samples of 10 units per sample from a production process. Assume the process was considered to be in control during the period these samples were collected. The results are as follows:
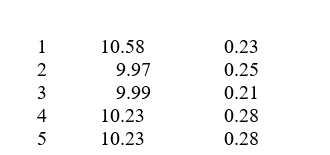 -The LCL for the three sigma X bar chart for the process is approximately (for a sample size of 10, A2 = 0.308):
(Multiple Choice)
4.8/5 (37)
Number of defects = 1,201; opportunities for a defect to occur = 18; number of units = 1,000
-What is the Six Sigma operating level?
(Multiple Choice)
4.8/5 (42)
Oliver's pizza shop tracks customer complaints every day and then follows up with their customers to resolve problems. For the past 30 days, they received a total of 127 various complaints from unhappy customers.
-Calculate the lower control limits for the C chart using z = 3
(Multiple Choice)
4.9/5 (41)
A product has 9 parts, the company has produced 1,500 units, and so far, they have had 700 customer complaints about quality.
-What is the company's probable DPMO?
(Multiple Choice)
4.7/5 (34)
The regional manager of a drive-thru restaurant is using statistical quality control on a new beverage, and first develops an  chart to see whether he is achieving the goal of 44 ounces. He calculates his center line using this data and arrives at the value 45.03. "Not ideal," he muses, "but at least the customers won't complain. If I were consistently delivering less than 44 ounces, I'd probably have a lawsuit on my hands. The
  and R charts both look good, and my calculations indicate a process standard deviation of 3.08. The process engineers have designed our drink process with an upper tolerance of 46 ounces and a lower tolerance of 42 ounces. I wonder what our process capability really is? I've been reading about Six Sigma, it would be fantastic if we could add that to our already fantastic slogan regarding this new beverage!". Calculate the Cpk.
(Multiple Choice)
4.7/5 (41)
Sample means and ranges were obtained for five samples of 10 units per sample from a production process. Assume the process was considered to be in control during the period these samples were collected. The results are as follows:
-The UCL for the three sigma X bar chart for the process is approximately (for a sample size of 10, A2 = 0.308):
(Multiple Choice)
4.8/5 (42)
Fifteen samples of size 10 are taken from a stable process. The average of the sample means is 32.8, and the average range of the samples is 1.5. Use the information contained in the chart below (Table 13s.1):
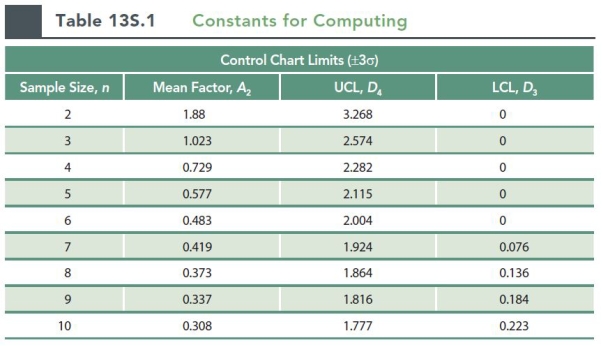 -The LCL for the three sigma X bar chart for the process is approximately (for a sample size of 10, A2 = 0.308):
(Multiple Choice)
4.9/5 (35)
Number of defects = 8,100; opportunities for a defect to occur = 22; number of units = 125,000
-What is the Six Sigma operating level?
(Multiple Choice)
4.9/5 (28)
Oliver's pizza shop tracks customer complaints every day and then follows up with their customers to resolve problems. For the past 30 days, they received a total of 127 various complaints from unhappy customers.
-Calculate  " , the mean errors ( also the sample variance).
(Multiple Choice)
4.8/5 (42)
Oliver's pizza shop tracks customer complaints every day and then follows up with their customers to resolve problems. For the past 30 days, they received a total of 127 various complaints from unhappy customers.
-Calculate the upper control limits for the C chart using z = 3
(Multiple Choice)
4.8/5 (42)
Fifteen samples of size 10 are taken from a stable process. The average of the sample means is 32.8, and the average range of the samples is 1.5. Use the information contained in the chart below (Table 13s.1):
-The UCL for the three sigma X bar chart for the process is approximately (for a sample size of 10, A2 = 0.308):
(Multiple Choice)
5.0/5 (34)
An insurance company auditor takes eight samples of 250 completed forms to establish control limits for the fraction of insurance policy forms that are filled out incorrectly. The data appear in this table:
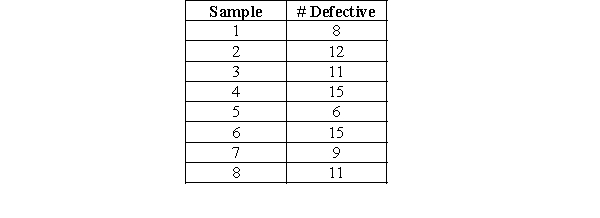 -Calculate the lower control limit for the chart, using z = 3.
(Multiple Choice)
4.8/5 (32)
Number of defects = 4,795; opportunities for a defect to occur = 315; number of units = 1,650,000
-Calculate the defects per million opportunities, DPMO.
(Multiple Choice)
4.9/5 (51)
Filters
- Essay(0)
- Multiple Choice(0)
- Short Answer(0)
- True False(0)
- Matching(0)