Exam 13: Supplement: Statistical Quality Control and Six Sigma Quality Management
Exam 1: Operations Management, Processes, and Supply Chain Management41 Questions
Exam 2: Corporate Strategy, Performance, and Sustainability55 Questions
Exam 3: Product Design and Development50 Questions
Exam 4: Process Design and Capacity Management48 Questions
Exam 5: Customer Relationships and Customer Service50 Questions
Exam 6: Demand Management, Forecasting, and Aggregate Planning45 Questions
Exam 7: Independent Demand Inventory Management45 Questions
Exam 8: Supplement: Job Scheduling and Vehicle Routing and Material Flow Analysis and Facility Layouts93 Questions
Exam 9: Lean Systems50 Questions
Exam 10: Managing Customer and Work Flows50 Questions
Exam 11: Managing Information Flowsmrp and ERP46 Questions
Exam 12: Managing Projects42 Questions
Exam 13: Supplement: Statistical Quality Control and Six Sigma Quality Management97 Questions
Exam 14: Supply Chain Processes50 Questions
Exam 15: Location, Logistics, and Product Returns49 Questions
Exam 16: Integrating Processes Along the Supply Chain42 Questions
Select questions type
A drive-in restaurant is running a new promotion, the "Route 44,"
named after an interstate that runs through their primary market area. The drink is promoted as 44 ounces of pure carbonated pleasure but the regional manager, being somewhat of a quality expert, wants to make sure that the company's drink process can deliver 44 ounces. She decides statistical quality control is the best way to monitor their process. For ten consecutive days she purchases five Route 44 drinks from franchise locations on her way to headquarters and turns them over to the testing lab for volume analysis. The data appear in the table, all amounts are in fluid ounces as measured by the testing lab. Since the regional manager is somewhat of a quality expert, she needs your help in formulating a control chart that will monitor the process performance to target.
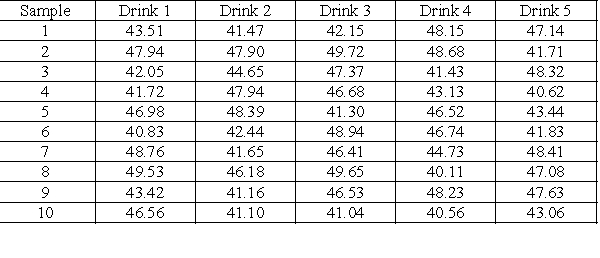 -What is the central line of the X bar chart for this process?
(Multiple Choice)
4.9/5  (41)
(41)
Romeo and Juliet make and sell cookies for their online business, Heartbreak Abode. They want to track quality, so they decide to calculate their defects per million opportunities, or DPMO, each month. For each box of cookies they sell, there can be 7 possible defects or customer complaints. During the last month, Heartbreak filled 725 orders. They received 49 complaints.
-What will be your best choice for the center's Six Sigma operating level?
(Multiple Choice)
4.7/5 (41)
A drive-in restaurant is running a new promotion, the "Route 44,"
named after an interstate that runs through their primary market area. The drink is promoted as 44 ounces of pure carbonated pleasure but the regional manager, being somewhat of a quality expert, wants to make sure that the company's drink process can deliver 44 ounces. She decides statistical quality control is the best way to monitor their process. For ten consecutive days she purchases five Route 44 drinks from franchise locations on her way to headquarters and turns them over to the testing lab for volume analysis. The data appear in the table, all amounts are in fluid ounces as measured by the testing lab. Since the regional manager is somewhat of a quality expert, she needs your help in formulating a control chart that will monitor the process performance to target.
-The LCL for the three sigma X bar chart for the process is approximately:
(Multiple Choice)
4.9/5 (28)
Sample means and ranges were obtained for five samples of 10 units per sample from a production process. Assume the process was considered to be in control during the period these samples were collected. The results are as follows:
 -The LCL for the three sigma R chart for the process is approximately (for a sample size of 10, D3 = 1.777, D4 = 0.223):
(Multiple Choice)
4.9/5 (31)
An airline wants to monitor the performance of their baggage handling crew on the daily flight from Syracuse to Boston that is always filled to its 140 passenger capacity. They track the number of passengers that lose bags each flight for a two week period. The data are displayed in the following table.
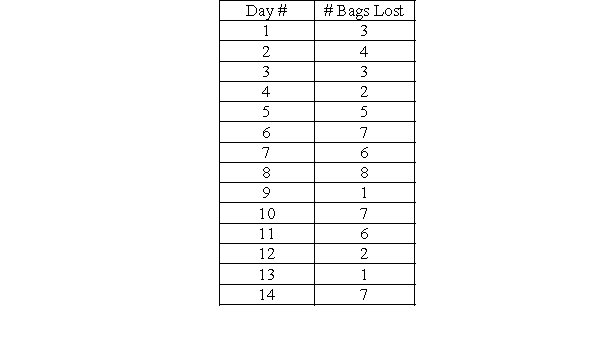 -Calculate P, the mean percent defective for all samples collected.
(Multiple Choice)
4.8/5 (34)
Sample means and ranges were obtained for five samples of 10 units per sample from a production process. Assume the process was considered to be in control during the period these samples were collected. The results are as follows:
-The UCL for the three sigma R chart for the process is approximately (for a sample size of 10, D3 = 1.777, D4 = 0.223):
(Multiple Choice)
4.9/5 (34)
Number of defects = 350; opportunities for a defect to occur = 10; number of units = 1,000
-To achieve a defects per million opportunities (DPMO) value of 32, what would be the number of defects?
(Multiple Choice)
4.8/5 (41)
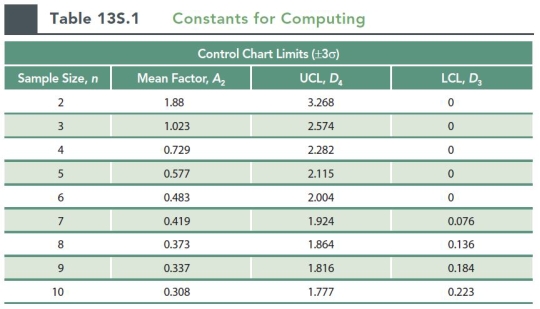
Fifteen samples of size 10 are taken from a stable process. The average of the sample means is 32.8, and the average range of the samples is 1.5. Use the information contained in the chart below (Table 13s.1):
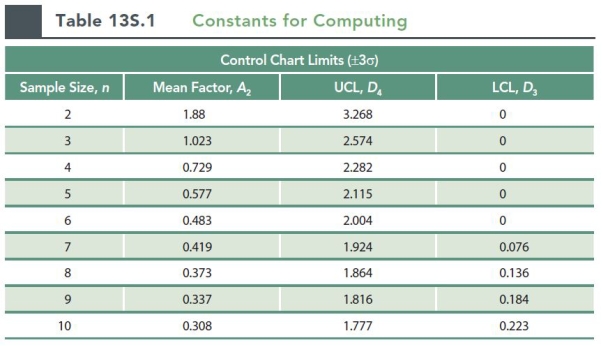 -The UCL for the three sigma R chart for the process is approximately (for a sample size of 10, D3 = 1.777, D4 = 0.223):
(Multiple Choice)
4.9/5 (27)
Number of defects = 750; opportunities for a defect to occur = 5; number of units = 16,000
-What is the Six Sigma operating level?
(Multiple Choice)
5.0/5 (32)
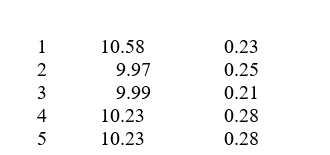
An insurance company auditor takes eight samples of 250 completed forms to establish control limits for the fraction of insurance policy forms that are filled out incorrectly. The data appear in this table:
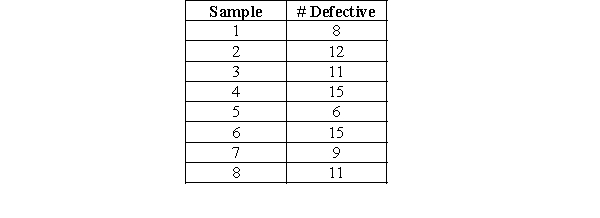 -Calculate P, the mean percent defective for all samples collected.
(Multiple Choice)
4.9/5 (42)
A product has 9 parts, the company has produced 1,500 units, and so far, they have had 700 customer complaints about quality.
-What will be your best choice for the company's Six Sigma operating level?
(Multiple Choice)
4.9/5 (31)
A firm recently produced 7,778 units, with a total defect level of 90. Each unit can have 32 defects.
-To achieve a percentage of defect-free output of 99.977, what would be the defect level?
(Multiple Choice)
4.8/5 (38)
The St. Helena Heritage Center at Marquette, Michigan, wants to start analyzing their company's customer service quality. For each type of service the center provides, there are 6 types of customer complaints. During the last 12 months, the center had 8,876 visitors and received a total of 1,253 complaints.
-To achieve a defects per million opportunities (DPMO) value of 6,210, what would be the number of complaints?
(Multiple Choice)
4.7/5 (39)
The St. Helena Heritage Center at Marquette, Michigan, wants to start analyzing their company's customer service quality. For each type of service the center provides, there are 6 types of customer complaints. During the last 12 months, the center had 8,876 visitors and received a total of 1,253 complaints.
-To achieve a percentage of defect-free output of 99.865, what would be the number of complaints?
(Multiple Choice)
4.9/5 (35)
A company currently produced 750,000 units, with a total defect level of 6,300. Each unit has a potential of 300 defects.
-What is the company's probable DPMO?
(Multiple Choice)
4.7/5 (39)
A company currently produced 750,000 units, with a total defect level of 6,300. Each unit has a potential of 300 defects.
-When the sigma level is 3, the percentage of defect-free output is _______.
(Multiple Choice)
4.8/5 (41)
The St. Helena Heritage Center at Marquette, Michigan, wants to start analyzing their company's customer service quality. For each type of service the center provides, there are 6 types of customer complaints. During the last 12 months, the center had 8,876 visitors and received a total of 1,253 complaints.
-What will be your best choice for the center's Six Sigma operating level?
(Multiple Choice)
4.9/5 (40)
A company currently produced 750,000 units, with a total defect level of 6,300. Each unit has a potential of 300 defects.
-When the percentage of defect-free output is 84.13, the sigma level is _______.
(Multiple Choice)
4.8/5 (41)
Number of defects = 350; opportunities for a defect to occur = 10; number of units = 1,000
-To achieve a percentage of defect-free output of 99.38, what would be the number of defects?
(Multiple Choice)
4.9/5 (33)
Use the information contained in this chart to determine your answer. Twenty samples of size 8 were taken from a stable process. From past studies of the process, you know that the overall mean is 42.5 and that the average of the samples range is 2.0.
 -The UCL for the three sigma R chart for the process is approximately (for a sample size of 8, D3 = 0.136, D4 = 1.864):
(Multiple Choice)
4.8/5 (27)
Filters
- Essay(0)
- Multiple Choice(0)
- Short Answer(0)
- True False(0)
- Matching(0)