Exam 6: Demand Management, Forecasting, and Aggregate Planning
Exam 1: Operations Management, Processes, and Supply Chain Management41 Questions
Exam 2: Corporate Strategy, Performance, and Sustainability55 Questions
Exam 3: Product Design and Development50 Questions
Exam 4: Process Design and Capacity Management48 Questions
Exam 5: Customer Relationships and Customer Service50 Questions
Exam 6: Demand Management, Forecasting, and Aggregate Planning45 Questions
Exam 7: Independent Demand Inventory Management45 Questions
Exam 8: Supplement: Job Scheduling and Vehicle Routing and Material Flow Analysis and Facility Layouts93 Questions
Exam 9: Lean Systems50 Questions
Exam 10: Managing Customer and Work Flows50 Questions
Exam 11: Managing Information Flowsmrp and ERP46 Questions
Exam 12: Managing Projects42 Questions
Exam 13: Supplement: Statistical Quality Control and Six Sigma Quality Management97 Questions
Exam 14: Supply Chain Processes50 Questions
Exam 15: Location, Logistics, and Product Returns49 Questions
Exam 16: Integrating Processes Along the Supply Chain42 Questions
Select questions type
A company has the data shown in the chart below concerning its forecast performance over the past five time periods.
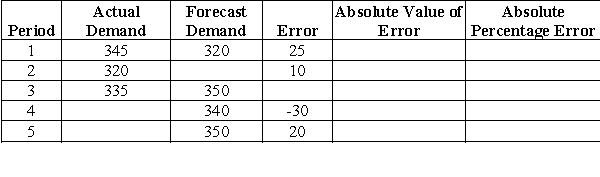 -Calculate the absolute percentage error for Period 1.
(Multiple Choice)
4.7/5  (34)
(34)
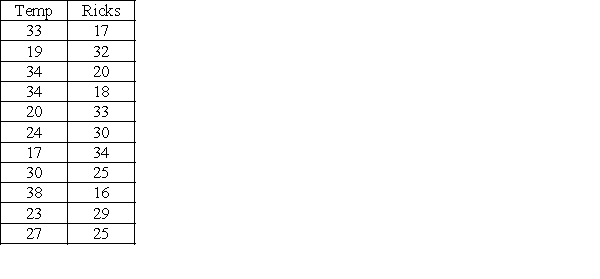
A well-educated lumberjack decides to use linear regression to predict the demand for firewood based on the ambient temperature. He has collected data on firewood sales and temperature for the last several days and has performed some preliminary calculations as shown in the table.
 -Sampson and Delilah advertising company is interested in an appropriate mix of print, radio, and television ads for their new client. Steven Nash performs a multiple regression on the effects of dollars spent on each type of media on dollars of sales of product. Nash uses data from the most recent advertising campaigns and develops the following equation:
Y = 254,215 + 6.79 * Print - 1.4 * Radio + 16.87 *Television
The r-squared statistic is 0.77. Which of the following statements is BEST?
-Sampson and Delilah advertising company is interested in an appropriate mix of print, radio, and television ads for their new client. Steven Nash performs a multiple regression on the effects of dollars spent on each type of media on dollars of sales of product. Nash uses data from the most recent advertising campaigns and develops the following equation:
Y = 254,215 + 6.79 * Print - 1.4 * Radio + 16.87 *Television
The r-squared statistic is 0.77. Which of the following statements is BEST?
(Multiple Choice)
4.8/5 (39)
A company has the data shown in the chart below concerning its forecast performance over the past five time periods.
-Calculate the actual demand for Period 5.
(Multiple Choice)
5.0/5 (35)
A well-educated lumberjack decides to use linear regression to predict the demand for firewood based on the ambient temperature. He has collected data on firewood sales and temperature for the last several days and has performed some preliminary calculations as shown in the table.
-What is his regression equation based on the data?
(Multiple Choice)
4.7/5 (41)
 -For Plutonium Courtyard Hotel in Wendover, Saturday is the best day of the week for business. The gambling take for the hotel on Saturdays over the past four weeks was as follows:
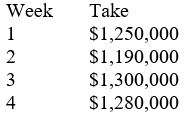 Plutonium Courtyard uses a three-period weighted moving average to forecast demand, with wt = 0.6, wt-1 = 0.3, and wt-2 = 0.1. What is the forecast for Week 5?
(Multiple Choice)
4.8/5 (32)
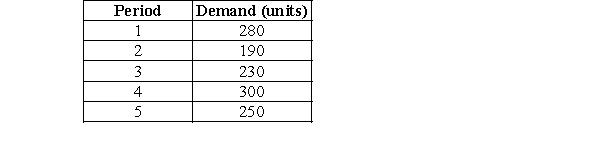
Humboldt Corporation is preparing an aggregate production plan for fasteners for the next four quarters. The company's expected quarterly demand is given in the following table. The company will have 1,000 fasteners in inventory at the beginning of the year and wishes to maintain at least that number at the end of each quarter. Following is other critical data:
Production cost per unit = $250
Inventory carrying cost per quarter per unit = $10 (based on quarter-ending inventory)
Hiring cost per worker = $1,000
Firing cost per worker = $2,000
Beginning number of workers = 10
Each worker can produce 100 units per quarter.
Any worker on the staff at the end of the year will not be fired at that time.
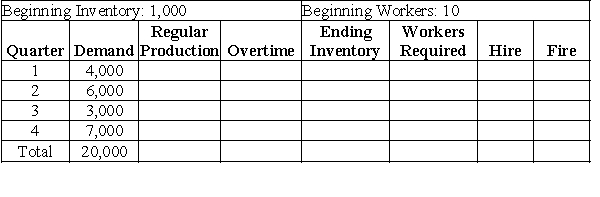 -Given the above information, what is the total cost of a level plan?
(Multiple Choice)
4.9/5 (35)
-Calculate the three-period weighted moving average for Period 5 using the weights, wt = 0.5, wt-1 = 0.2, wt-2 = 0.2 and wt-3 = 0.1
(Multiple Choice)
4.9/5 (41)
A company has the data shown in the chart below concerning its forecast performance over the past five time periods.
-Calculate the mean absolute percentage error (MAPE).
(Multiple Choice)
4.7/5 (28)
A well-educated lumberjack decides to use linear regression to predict the demand for firewood based on the ambient temperature. He has collected data on firewood sales and temperature for the last several days and has performed some preliminary calculations as shown in the table.
-Determine the regression equation based on the data. What is the sample correlation coefficient (R) for the regression equation?
(Multiple Choice)
4.8/5 (38)
A company has the data shown in the chart below concerning its forecast performance over the past five time periods.
-Calculate the tracking signal for Period 1 (TS = RSFE / MAD)
(Multiple Choice)
4.8/5 (33)
A company has the information shown in the chart below regarding its forecast performance in the past three periods.
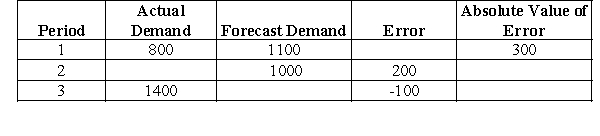 -Calculate the running sum of forecast error (RSFE) that provides a measure of forecast bias.
(Multiple Choice)
4.9/5 (34)
Given the series of demand data below
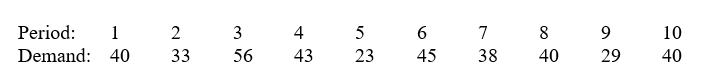 -Calculate the running sum of forecast error (RSFE) for n = 2 (two-period moving average) between Weeks 7 and 10.
(Multiple Choice)
4.9/5 (37)
A company has the data shown in the chart below concerning its forecast performance over the past five time periods.
-Calculate the mean absolute deviation (MAD).
(Multiple Choice)
4.7/5 (37)
A firm's demand data from the last two quarters is displayed in the table.
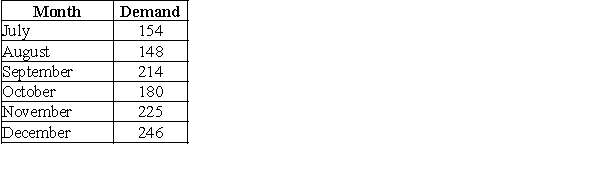 -If last period's forecast was 27, and the actual demand was 30, what was the forecast error?
(Multiple Choice)
4.7/5 (30)
Given the series of demand data below
-What is the two-period moving-average forecast for Week 9?
(Multiple Choice)
4.8/5 (35)
-Over a six-month period, the demand for a product has been as follows: January = 200, February = 210, March = 240, April = 240, May = 260, and June = 280. The five-month moving average forecast for July is _______.
(Multiple Choice)
4.8/5 (34)
Given the series of demand data below
-What is the six-period moving-average forecast for Week 10?
(Multiple Choice)
4.9/5 (39)
Given the series of demand data below
-Calculate the mean absolute deviation (MAD) for n = 4 (four-period moving average) between Weeks 7 and 10.
(Multiple Choice)
4.7/5 (31)
A firm's demand data from the last two quarters is displayed in the table.
-What is the three-period moving average for January's demand?
(Multiple Choice)
4.8/5 (37)
Filters
- Essay(0)
- Multiple Choice(0)
- Short Answer(0)
- True False(0)
- Matching(0)