Exam 3: Numerically Summarizing Data
Exam 1: Data Collection34 Questions
Exam 2: Organizing and Summarizing Data30 Questions
Exam 3: Numerically Summarizing Data66 Questions
Exam 4: Describing the Relation Between Two Variables92 Questions
Exam 5: Probability91 Questions
Exam 6: Discrete Probability Distributions32 Questions
Exam 7: The Normal Probability Distributions36 Questions
Exam 8: Sampling Distributions12 Questions
Exam 9: Estimating the Value of a Parameter Using Confidence Intervals24 Questions
Exam 10: Hypothesis Tests Regarding a Parameter36 Questions
Exam 11: Inference on Two Samples65 Questions
Exam 12: Inference on Categorical Data16 Questions
Exam 13: Comparing Three or More Means15 Questions
Exam 14: Inference of the Least-Squares Regression Model28 Questions
Select questions type
The April precipitation amounts (in inches) for 10 cities are listed below. Find the range of the data. 
(Multiple Choice)
4.9/5  (35)
(35)
A random sample of sale prices of homes yielded the following summary information:
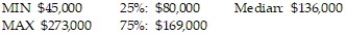 Comment on a home that had a sale price of $425,000.
(Multiple Choice)
4.9/5 (36)
The accompanying data set contains quiz scores for 12 students in a chemistry class: 18, 15, 5, 8, 15, 20, 2, 16, 10, 12, 20, 15.
a. Find a measure of central tendency that separates the data into two groups such that each groupconsists of 50% of the scores above and 50% of the scores below that measure.
b. Find a measure of central tendency that represents the quiz score that occurs most often.
c. Find a measure of central tendency that represents the average of the 12 quiz scores.
(Short Answer)
4.9/5 (35)
For the following data, approximate the mean weekly grocery bill. 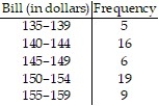
(Multiple Choice)
4.8/5 (29)
Compute the range for the set of data.
-0.224, 0.114, 0.451, 0.435, 0.645, 0.338
(Multiple Choice)
4.9/5 (39)
Compute the range for the set of data.
-6, 16, 6, 16, 6, 16, 6, 16
(Multiple Choice)
4.9/5 (33)
Find the sample standard deviation.
-115, 251, 179, 138, 112, 100, 151, 127, 105
(Multiple Choice)
4.9/5 (41)
Given the following five-number summary, find the IQR. 2.9, 5.7, 10.0, 13.2, 21.1.
(Multiple Choice)
4.9/5 (29)
A severe drought affected several western states for 3 years. A Christmas tree farmer is worried about the drought's effect on the size of his trees. To decide whether the growth of the trees has been retarded, the farmer decides to take a sample of the heights of 25 trees and obtains the following results (recorded in inches): 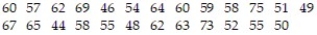 The tree farmer feels the normal height of a tree that was unaffected by the drought would be 65 inches. Find the z-score for a tree that is 65 inches tall.
(Multiple Choice)
4.9/5 (40)
A group of 79 students were asked how far they commute to work from home each time they go to work from home. The results are given below. Would a drive of 15 miles be considered an outlier? 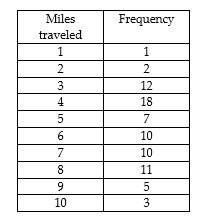
(True/False)
4.7/5 (35)
The following data represents a random sample of 15 complaints registered with the customer service department of a store. Determine the median complaint. 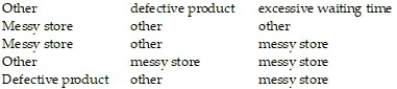
(Multiple Choice)
4.7/5 (42)
For the following data set, approximate the sample standard deviation of monthly telephone bills (in dollars). 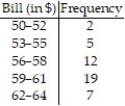
(Multiple Choice)
4.7/5 (27)
The number of goals scored by a random sample of 16 hockey players for a given season are 5, 3, 21, 10, 7, 2, 0, 30, 19, 6, 4, 7, 10, 5, 7, and 24. Compute the mean, median, and mode.
(Short Answer)
4.9/5 (27)
Compute the range for the set of data.
-2.4, 5.6, 1.5, 4.2, 6.4, 3.2
(Multiple Choice)
4.9/5 (32)
Compute the range for the set of data.
-120, 553, 133, 641, 398, 335
(Multiple Choice)
4.7/5 (34)
When results from a scholastic assessment test are sent to test-takers, the percentiles associated with their scores are also given. Suppose a test-taker scored at the 9 8th percentile for their verbal grade and at the  percentile for their quantitative grade. Interpret these results.
(Multiple Choice)
4.8/5 (38)
Find the sample standard deviation.
-7, 5, 13, 18, 11, 17, 17, 20, 16
(Multiple Choice)
4.7/5 (37)
The high temperatures (in degrees Celsius) each day over a three week period were as follows: 17, 18, 20, 22, 21, 19, 16, 15, 18, 20, 21, 21, 22, 21, 19, 20, 19, 17, 16, 16, 17. Compute the mean, median, and mode.
(Short Answer)
4.9/5 (32)
Filters
- Essay(0)
- Multiple Choice(0)
- Short Answer(0)
- True False(0)
- Matching(0)