Exam 3: Numerically Summarizing Data
Exam 1: Data Collection34 Questions
Exam 2: Organizing and Summarizing Data30 Questions
Exam 3: Numerically Summarizing Data66 Questions
Exam 4: Describing the Relation Between Two Variables92 Questions
Exam 5: Probability91 Questions
Exam 6: Discrete Probability Distributions32 Questions
Exam 7: The Normal Probability Distributions36 Questions
Exam 8: Sampling Distributions12 Questions
Exam 9: Estimating the Value of a Parameter Using Confidence Intervals24 Questions
Exam 10: Hypothesis Tests Regarding a Parameter36 Questions
Exam 11: Inference on Two Samples65 Questions
Exam 12: Inference on Categorical Data16 Questions
Exam 13: Comparing Three or More Means15 Questions
Exam 14: Inference of the Least-Squares Regression Model28 Questions
Select questions type
On a recent day during the flu season, the Midtown Medical Clinic saw many patients. Patients had their temperatures taken (in °F). The distribution of temperatures is given below. Determine the standard deviation of the temperatures of a sample of 100 patients. 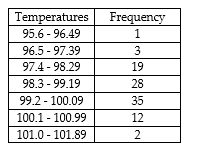
(Multiple Choice)
4.8/5  (34)
(34)
The grades are given for a student for a particular term. Find the grade point average. The point values of grades are given below. 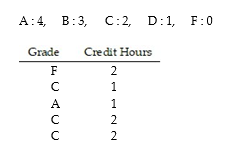
(Multiple Choice)
4.9/5 (36)
Find the sample standard deviation.
-5, 2, 18, 20, 10, 15, 15, 19, 9
(Multiple Choice)
4.9/5 (33)
Many firms use on-the-job training to teach their employees new software. Suppose you work in the personnel department of a firm that just finished training a group of its employees in new software, and you have been requested to review the performance of one of the trainees on the final test that was given to all trainees. The mean and standard deviation of the test scores are 70 and 4, respectively, and the distribution of scores is bell shaped. What percentage of test-takers scored better than a trainee who scored 58?
(Multiple Choice)
4.8/5 (28)
The cholesterol levels (in milligrams per deciliter) of 30 adults are listed below. Draw a boxplot that represents the data. 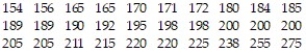
(Essay)
4.9/5 (32)
Compute the range for the set of data.
-8, 8, 8, 17, 23, 23, 23
(Multiple Choice)
4.8/5 (40)
Filters
- Essay(0)
- Multiple Choice(0)
- Short Answer(0)
- True False(0)
- Matching(0)