Exam 9: Inference for Regression
Exam 1: Collecting Data68 Questions
Exam 2: Describing Data127 Questions
Exam 3: Confidence Intervals149 Questions
Exam 4: Hypothesis Tests117 Questions
Exam 5: Approximating With a Distribution74 Questions
Exam 6: Inference for Means and Proportions166 Questions
Exam 7: CHI-Square Tests for Categorical Variables45 Questions
Exam 8: Anova to Compare Means53 Questions
Exam 9: Inference for Regression123 Questions
Exam 10: Multiple Regression72 Questions
Select questions type
Use the following to answer the questions below:
Students in a small statistics course wanted to investigate if forearm length (in cm) was useful for predicting foot length (in cm). The data they collected are displayed in the provided scatterplot (with regression), and the computer output from the analysis is provided.
Use three decimal places when reporting the results from any calculations, unless otherwise specified.
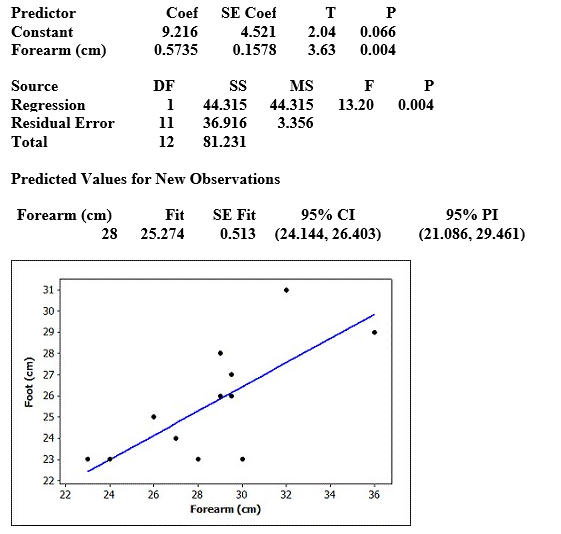 The regression equation is Foot (cm) = 9.22 + 0.574 Forearm (cm)
-When conducting inference for the population slope, it is most common to test if the population slope is different from zero. However, there are other situations where a different test might be more interesting. For instance, it is often said that the length of the forearm is roughly the same as the length of the foot (see, for example, the movie Pretty Woman). What population slope is implied by this statement, and what would the hypotheses for testing the accuracy of this claim look like?
The regression equation is Foot (cm) = 9.22 + 0.574 Forearm (cm)
-When conducting inference for the population slope, it is most common to test if the population slope is different from zero. However, there are other situations where a different test might be more interesting. For instance, it is often said that the length of the forearm is roughly the same as the length of the foot (see, for example, the movie Pretty Woman). What population slope is implied by this statement, and what would the hypotheses for testing the accuracy of this claim look like?
(Essay)
4.9/5  (39)
(39)
Use the following to answer the questions below:
Fast food restaurants are been required to publish nutrition information about the foods they serve. Nutrition information about a random sample of McDonald's lunch/dinner menu items (excluding sides and drinks) was obtained from their website. We wish to use the sodium content (in milligrams) to better understand the number of calories in the lunch/dinner menu items at McDonald's. Some summary statistics, partial computer output from a regression analysis, and a scatterplot (with regression line) of the data are provided.
Use two decimal places when reporting the results from any calculations, unless otherwise
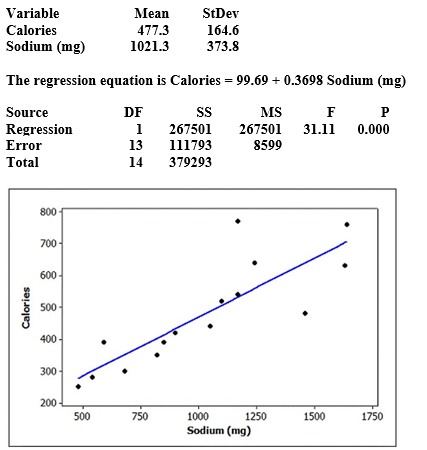 -Use the provided output to construct and interpret a 95% interval for the mean number of calories in all McDonald's lunch/dinner menu items with 1,000 mg of sodium.
(Multiple Choice)
4.8/5 (29)
Use the following to answer the questions below:
Fast food restaurants are required to publish nutrition information about the foods they serve. Nutrition information about a random sample of 15 McDonald's lunch/dinner menu items (excluding sides and drinks) was obtained from their website. We wish to use the total fat content (in grams) to better understand the number of calories in the lunch/dinner menu items at McDonald's. Computer output from a regression analysis and a scatterplot (with regression line) of the data are provided.
Use two decimal places when reporting the results from any calculations, unless otherwise specified.
The regression equation is Calories = 137.1 + 15.06 Total Fat (g)
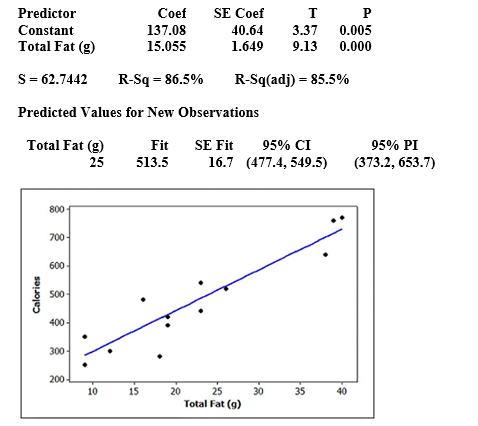 -Construct and interpret a 99% confidence interval for the population slope.
(Essay)
4.9/5 (27)
Use the following to answer the questions below:
Computer output from a regression analysis is provided.
The regression equation is Y = 72.9 - 0.519 X
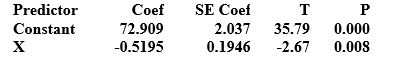 -What is the p-value for testing if the slope in the population is different from zero?
(Multiple Choice)
5.0/5 (38)
Use the following to answer the questions below:
Computer output from a regression analysis is provided.
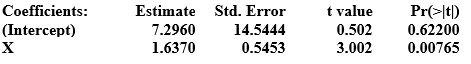 -The sample size in this situation is n = 20. Construct a 95% confidence interval for the population slope. Round the margin of error to three decimal places.
(Multiple Choice)
4.9/5 (34)
Use the following to answer the questions below:
A quantitatively savvy, young couple is interested in purchasing a home in northern New York. They collected data on 48 houses that had recently sold in the area. They want to predict the selling price of homes (in thousands of dollars) based on the size of the home (in square feet).
The regression equation is Price (in thousands) = 17.1 + 0.0643 Size (sq. ft.)
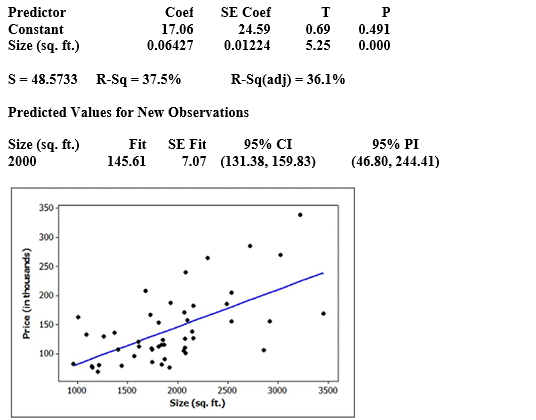 -What is the estimated slope in this regression model? Interpret the slope in context.
(Multiple Choice)
5.0/5 (32)
Use the following to answer the questions below:
Fast food restaurants are required to publish nutrition information about the foods they serve. Nutrition information about a random sample of 15 McDonald's lunch/dinner menu items (excluding sides and drinks) was obtained from their website. We wish to use the total fat content (in grams) to better understand the number of calories in the lunch/dinner menu items at McDonald's. Computer output from a regression analysis and a scatterplot (with regression line) of the data are provided.
Use two decimal places when reporting the results from any calculations, unless otherwise specified.
The regression equation is Calories = 137.1 + 15.06 Total Fat (g)
-Use the computer output, and α = 0.05, to test the slope to determine whether total fat content (g) is an effective predictor of the number of calories. Include all details of the test.
(Essay)
4.8/5 (40)
Use the following to answer the questions below:
Computer output from a regression analysis is provided.
-What is the standard error of the sample slope?
(Multiple Choice)
4.8/5 (35)
Use the following output to identify and interpret a 95% interval for the mean selling price of all 50-year-old homes in this portion of northern New York.
Predicted Values for New Observations

(Multiple Choice)
4.9/5 (34)
Use the following to answer the questions below:
Fast food restaurants are been required to publish nutrition information about the foods they serve. Nutrition information about a random sample of McDonald's lunch/dinner menu items (excluding sides and drinks) was obtained from their website. We wish to use the sodium content (in milligrams) to better understand the number of calories in the lunch/dinner menu items at McDonald's. Some summary statistics, partial computer output from a regression analysis, and a scatterplot (with regression line) of the data are provided.
Use two decimal places when reporting the results from any calculations, unless otherwise
-Using the scatterplot, should we should have any serious concerns about the conditions being met for using a linear model with these data.
(True/False)
4.8/5 (34)
Use the following to answer the questions below:
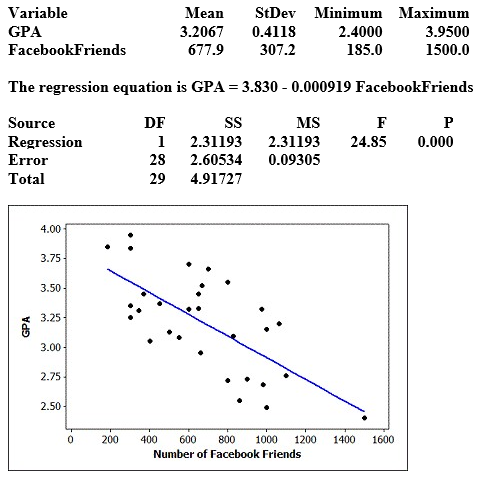
Data were collected on GPA and number of Facebook friends for students in a small statistics class. Some summary statistics, partial output from the regression analysis, and a scatterplot of the data (with regression line) are provided. Assume that students in this class are typical of all students at the university.
Use three decimal places when reporting the results from any calculations, unless otherwise specified.
 -Use the following output to identify and interpret a 95% interval for the GPA of a single student with 500 Facebook friends.
Predicted Values for New Observations
-Use the following output to identify and interpret a 95% interval for the GPA of a single student with 500 Facebook friends.
Predicted Values for New Observations

(Multiple Choice)
4.9/5 (32)
Use the following to answer the questions below:
Data were collected on the age (in years) and price (in thousands of dollars) of a random sample of 25 used Hyundai Elantras. A scatterplot of the data (with regression line) and computer output from a regression analysis are provided.
Use three decimal places when reporting the results from any calculations, unless otherwise specified.
The regression equation is Price = 15.3 - 1.71 Age
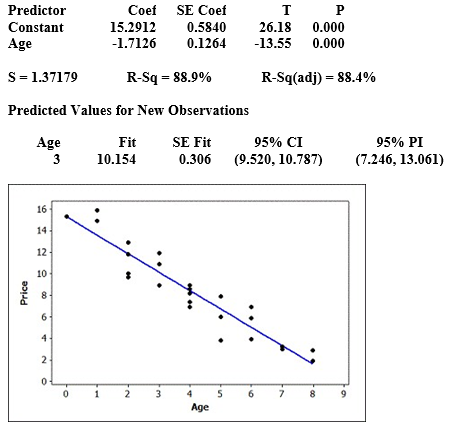 -Use the equation of the least squares line to predict the price of a used Hyundai Elantra that is 6 years old.
(Multiple Choice)
4.8/5 (32)
Use the following to answer the questions below:
Fast food restaurants are required to publish nutrition information about the foods they serve. Nutrition information about a random sample of 15 McDonald's lunch/dinner menu items (excluding sides and drinks) was obtained from their website. We wish to use the total fat content (in grams) to better understand the number of calories in the lunch/dinner menu items at McDonald's. Computer output from a regression analysis and a scatterplot (with regression line) of the data are provided.
Use two decimal places when reporting the results from any calculations, unless otherwise specified.
The regression equation is Calories = 137.1 + 15.06 Total Fat (g)
-Use the computer output to provide and interpret a 95% interval for the mean number of calories in all McDonald's lunch/menu items with 25 total grams of fat.
(Multiple Choice)
4.8/5 (35)
Use the following to answer the questions below:
Data were collected on GPA and number of Facebook friends for students in a small statistics class. Some summary statistics, partial output from the regression analysis, and a scatterplot of the data (with regression line) are provided. Assume that students in this class are typical of all students at the university.
Use three decimal places when reporting the results from any calculations, unless otherwise specified.
-Use the information in the ANOVA table to compute and interpret  .
.
(Multiple Choice)
4.8/5 (30)
Use the following to answer the questions below:
Computer output from a regression analysis is provided.
-What is the p-value for testing if the slope in the population is different from zero?
(Multiple Choice)
4.8/5 (36)
Use the following to answer the questions below:
Computer output from a regression analysis is provided.
The regression equation is Y = 72.9 - 0.519 X
-What is the sample slope for this model?
(Multiple Choice)
4.9/5 (29)
Use the following to answer the questions below:
Computer output from a regression analysis is provided.
The regression equation is Y = 72.9 - 0.519 X
-The sample size in this situation is n = 157. What are the degrees of freedom for constructing a confidence interval for, or performing a test about, the population slope?
(Multiple Choice)
4.9/5 (28)
Use the following to answer the questions below:
Students in a small statistics course wanted to investigate if forearm length (in cm) was useful for predicting foot length (in cm). The data they collected are displayed in the provided scatterplot (with regression), and the computer output from the analysis is provided.
Use three decimal places when reporting the results from any calculations, unless otherwise specified.
The regression equation is Foot (cm) = 9.22 + 0.574 Forearm (cm)
-What is the estimated slope in this regression model?
(Multiple Choice)
4.8/5 (35)
Use the following to answer the questions below:
A quantitatively savvy, young couple is interested in purchasing a home in northern New York. They collected data on houses that had recently sold in the area. They want to predict the selling price of homes (in thousands of dollars) based on the age of the home (in years). Some summary statistics, partial regression output, and a scatterplot of the relationship (with regression line) are provided.
Use two decimal places when reporting the results from any calculations, unless otherwise specified.
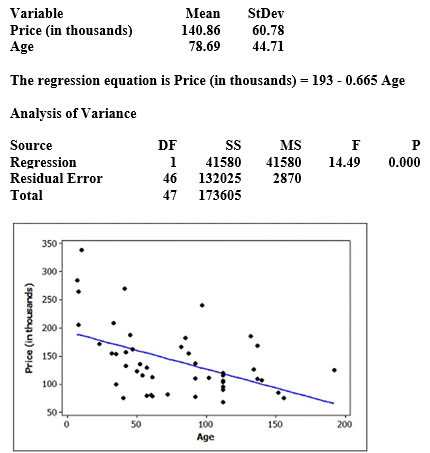 -Using the scatterplot, should we have any major concerns about the conditions being met for using a linear model with these data?
(True/False)
4.7/5 (42)
Filters
- Essay(0)
- Multiple Choice(0)
- Short Answer(0)
- True False(0)
- Matching(0)