Exam 5: Theory of Consumer Behavior
Exam 1: Managers, Profits, and Markets25 Questions
Exam 2: Demand, Supply, and Market Equilibrium52 Questions
Exam 3: Marginal Analysis for Optimal Decision Making25 Questions
Exam 4: Basic Estimation Techniques50 Questions
Exam 5: Theory of Consumer Behavior52 Questions
Exam 6: Elasticity and Demand47 Questions
Exam 7: Demand Estimation and Forecasting66 Questions
Exam 8: Production and Cost in the Short Run33 Questions
Exam 9: Production and Cost in the Long Run52 Questions
Exam 10: Production and Cost Estimation53 Questions
Exam 11: Managerial Decisions in Competitive Markets58 Questions
Exam 12: Managerial Decisions for Firms With Market Power68 Questions
Exam 13: Strategic Decision Making in Oligopoly Markets54 Questions
Exam 14: Advanced Techniques for Profit Maximization67 Questions
Exam 15: Decisions Under Risk and Uncertainty35 Questions
Exam 16: Government Regulation of Business29 Questions
Select questions type
The following figure shows a portion of a consumer's indifference map and budget lines. The price of good Y is $17 and the consumer's income is $7,650.
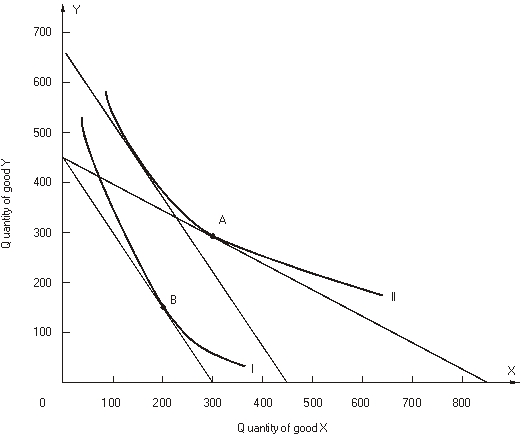 Let the consumer begin in utility-maximizing equilibrium at point A on indifference curve II. Next the price of good X changes so that the consumer moves to a new utility-maximizing equilibrium at point B on indifference curve I.
-The substitution effect of the change in the price of X is _________; the income effect is _________; the total effect is _________.
Let the consumer begin in utility-maximizing equilibrium at point A on indifference curve II. Next the price of good X changes so that the consumer moves to a new utility-maximizing equilibrium at point B on indifference curve I.
-The substitution effect of the change in the price of X is _________; the income effect is _________; the total effect is _________.
(Short Answer)
4.8/5  (36)
(36)
The following questions refer to the following graph of a consumer's indifference curve.
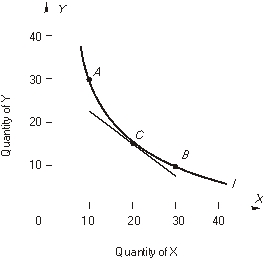 -At point C the consumer's marginal rate of substitution at point is approximately ______. This means that the consumer is willing to substitute at a rate of ______ units of Y for one more X or ______ X for one Y.
(Short Answer)
4.8/5 (42)
Fill-in-the-Blank
-Along an indifference curve ____________ is constant.
(Short Answer)
4.8/5 (40)
refer to the following:
 The price of Y is $10.
-The marginal rate of substitution of X for Y at point C is:
The price of Y is $10.
-The marginal rate of substitution of X for Y at point C is:
(Multiple Choice)
4.9/5 (40)
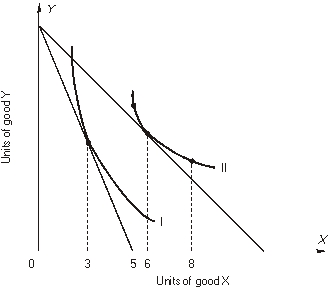
refer to the following figure:
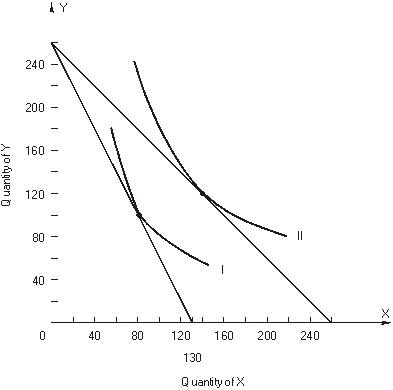 The consumer's income is $2,600.
-Two points on this consumer's demand for good X are
The consumer's income is $2,600.
-Two points on this consumer's demand for good X are
(Multiple Choice)
4.8/5 (34)
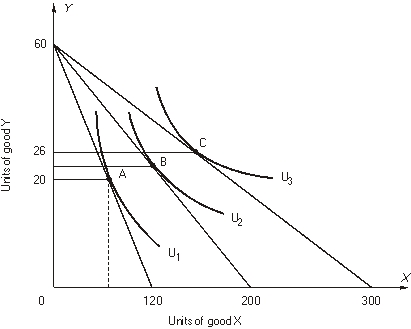
Use the following graph showing a consumer's budget line and some indifference curves to answer the following questions. The consumer's income is $600.
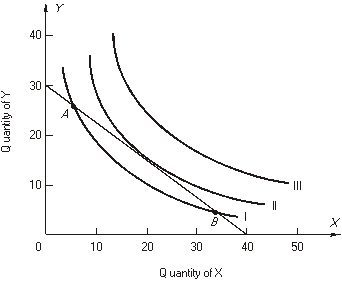 -If the consumer is buying the combination at point A, the MRS is ________________ (greater, less) than the price _________, so the consumer should buy more ______ and less ______ in order to increase utility. The consumer would buy no combination on indifference curve III because _______________.
(Short Answer)
4.9/5 (43)
refer to the following figure:
The consumer's income is $2,600.
-In order to isolate the income and substitution effects what must have happened, temporarily, to the consumer's income (approximately)?
(Multiple Choice)
4.8/5 (36)
refer to the following figure that shows the effect of an INCREASE in the price of X.
 -The total effect of the price change is the change in the consumption of X from
(Multiple Choice)
4.8/5 (44)
refer to the following figure:
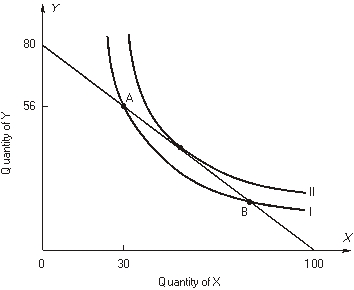 The consumer's income is $800.
-What are the prices of goods X and Y?
The consumer's income is $800.
-What are the prices of goods X and Y?
(Multiple Choice)
4.8/5 (41)
The following figure shows a portion of a consumer's indifference map and budget lines. The price of good Y is $17 and the consumer's income is $7,650.
Let the consumer begin in utility-maximizing equilibrium at point A on indifference curve II. Next the price of good X changes so that the consumer moves to a new utility-maximizing equilibrium at point B on indifference curve I.
-Two points on this consumer's demand for good X are PX= $_________ and X = _________; and PX = $_________ and X = _________.
(Short Answer)
4.8/5 (37)
refer to the following figure:
The consumer's income is $800.
-Why doesn't the consumer choose the combination of 30X and 56Y at point A?
(Multiple Choice)
4.9/5 (34)
The marginal rate of substitution of X for Y is 3, the price of X is $4, and the price of Y is $2.
-The consumer must give up ______ units of Y to obtain another X. The consumer must give up ______ units of X to obtain another Y. At what rate is the consumer able to substitute X for Y in the market? ______.
(Short Answer)
4.9/5 (38)
refer to the following graphs:
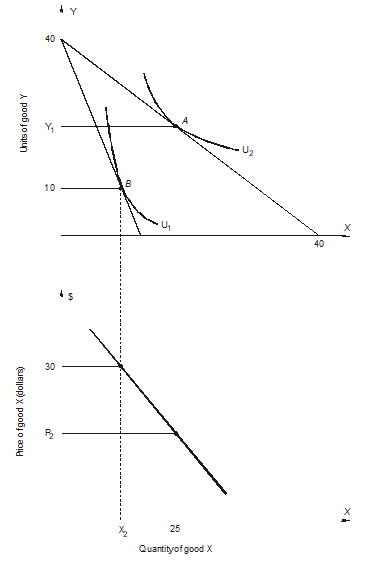 The price of Y is $15 per unit.
-What is
The price of Y is $15 per unit.
-What is

(Multiple Choice)
4.8/5 (42)
Use the following graph showing a consumer's budget line and some indifference curves to answer the following questions. The consumer's income is $600.
-If the consumer is buying the combination at point B, the MRS is ______ than the price ____________, so the consumer should buy more ______ and less ______ to increase utility. At point B,  is ____________ than the
  .
.
(Short Answer)
4.9/5 (42)
refer to the following figure:
The consumer's income is $2,600.
-The income effect of the increase in the price of X is (approximately)
(Multiple Choice)
4.8/5 (36)
The following figure shows a portion of a consumer's indifference map and budget lines. The price of good Y is $17 and the consumer's income is $7,650.
Let the consumer begin in utility-maximizing equilibrium at point A on indifference curve II. Next the price of good X changes so that the consumer moves to a new utility-maximizing equilibrium at point B on indifference curve I.
-Good X is a(an) ____________ good.
(Short Answer)
4.9/5 (31)
Filters
- Essay(0)
- Multiple Choice(0)
- Short Answer(0)
- True False(0)
- Matching(0)