Exam 16: Analysis of Variance
Exam 1: Statistics Success Stories and Cautionary Tales79 Questions
Exam 2: Turning Data Into Information94 Questions
Exam 3: Relationships Between Quantitative Variables99 Questions
Exam 4: Relationships Between Categorical Variables100 Questions
Exam 5: Sampling: Surveys and How to Ask Questions109 Questions
Exam 6: Gathering Useful Data for Examining Relationships90 Questions
Exam 7: Probability112 Questions
Exam 8: Random Variables115 Questions
Exam 9: Understanding Sampling Distributions: Statistics As Random Variables231 Questions
Exam 10: Estimating Proportions With Confidence104 Questions
Exam 11: Estimating Means With Confidence103 Questions
Exam 12: Testing Hypotheses About Proportions139 Questions
Exam 13: Testing Hypotheses About Means166 Questions
Exam 14: Inference About Simple Regression115 Questions
Exam 15: More About Inference for Categorical Variables111 Questions
Exam 16: Analysis of Variance111 Questions
Exam 17: Turning Information Into Wisdom70 Questions
Select questions type
Use the following information for questions:
A study compared testosterone levels among athletes in four sports: soccer, track, Lacrosse, and water polo. The total sample size was n =30 (10 soccer, 10 track, 5 Lacrosse, and 5 water polo). A one-way analysis of variance was used to compare the population mean levels for the four sports.
-The p-value for the F-test is = 0.02. Using the = 0.05 significance level, what is the conclusion?
(Multiple Choice)
4.8/5  (39)
(39)
Use the following information for questions:
A study was conducted to compare the mean sulfur dioxide concentrations for three cities. Independent random samples were obtained from each city and the concentration levels along with some summaries are provided below: 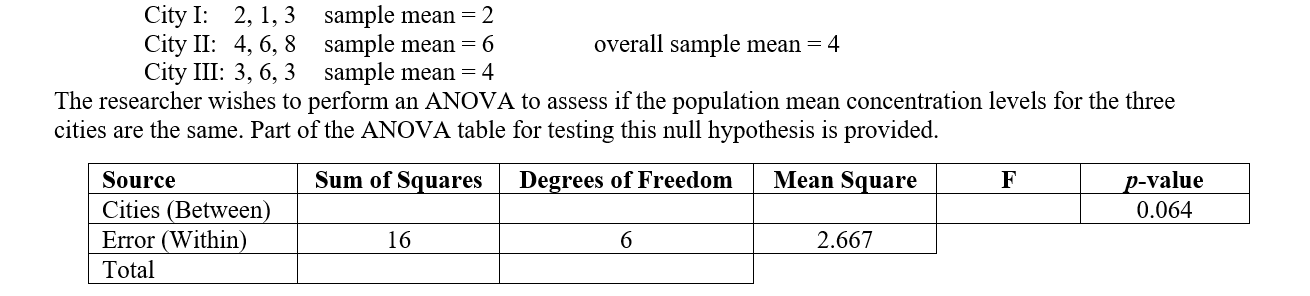 -Suppose the necessary assumptions hold. Using a 10% significance level, which of the following is the correct conclusion?
(Multiple Choice)
4.9/5 (30)
Use the following information for questions:
Using data from 496 respondents in a past General Social Survey, an analysis of variance is done to compare the mean ages in five populations defined by the highest educational degree received (no high school degree, high school degree, junior college, bachelor degree, graduate degree). Some Minitab output is shown below. 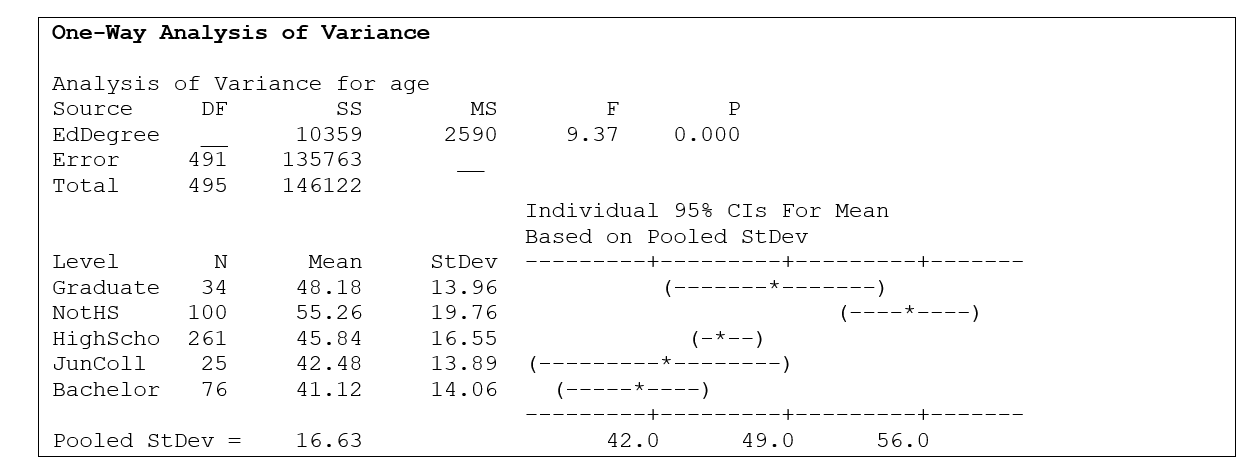 -State the null and alternative hypothesis for the analysis of variance.
(Short Answer)
4.8/5 (40)
Which one of the following choices describes a problem for which an analysis of variance would be appropriate?
(Multiple Choice)
4.7/5 (43)
Use the following information for questions:
Eighty-one customers of a large-chain grocery store are asked to fill out an in-store survey. One of the questions on the survey asks about the use of coupons, while another question asks how much money the customer spent on groceries during that specific trip. The surveyor records the gender of the customer on the survey as well. A two-way ANOVA is used to compare the mean amounts spent in the store between the four groups defined by the type of coupons the customers used and between genders. The SPSS output is provided below. 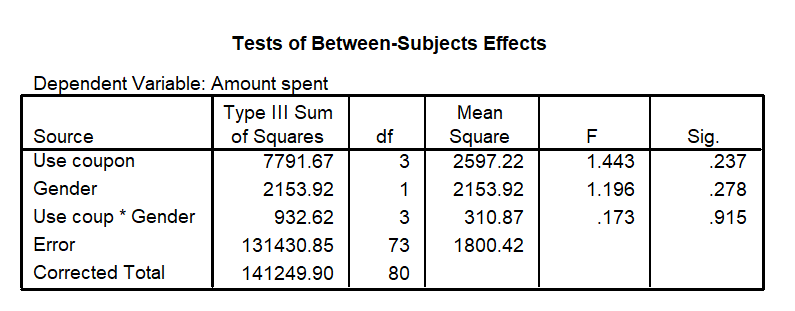 -The p-value for the interaction term is
(Multiple Choice)
4.7/5 (37)
Use the following information for questions:
Using data from 496 respondents in a past General Social Survey, a Kruskal-Wallis test is done to compare the median ages in five populations defined by the highest educational degree received (no high school degree, high school degree, junior college, bachelor degree, graduate degree). The Minitab output is provided below. 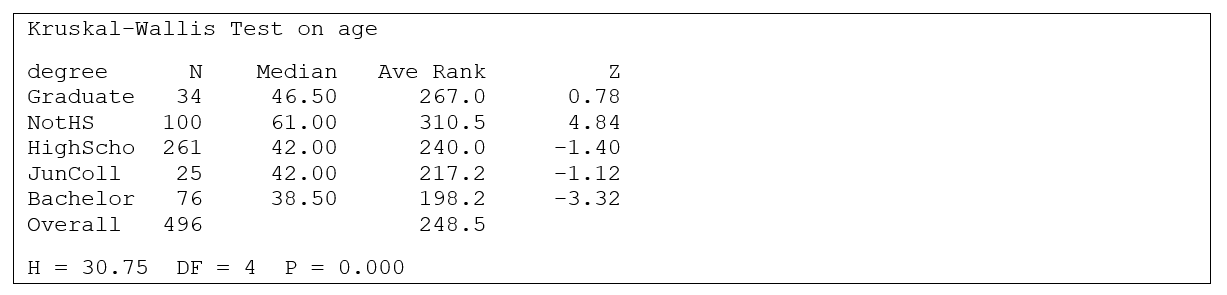 -What is the null hypothesis in this situation?
(Short Answer)
4.8/5 (35)
Use the following information for questions:
A study was conducted to compare the mean sulfur dioxide concentrations for three cities. Independent random samples were obtained from each city and the concentration levels along with some summaries are provided below:
-Some values in the ANOVA table are missing. Complete the ANOVA table. Specifically show your work for finding the SSGroups (or SS Between Cities)
(Essay)
4.7/5 (40)
Use the following information for questions:
On a survey conducted at a university, students were asked how they felt about their weight (about right, overweight, or underweight), and also were asked to record their grade point average (GPA). There were 234 responses, with 160 saying their weight was about right, 50 said they were overweight, and 17 underweight. The question of interest is whether mean GPA is the same or differs for different weight attitude populations. Minitab output for the study is given below.
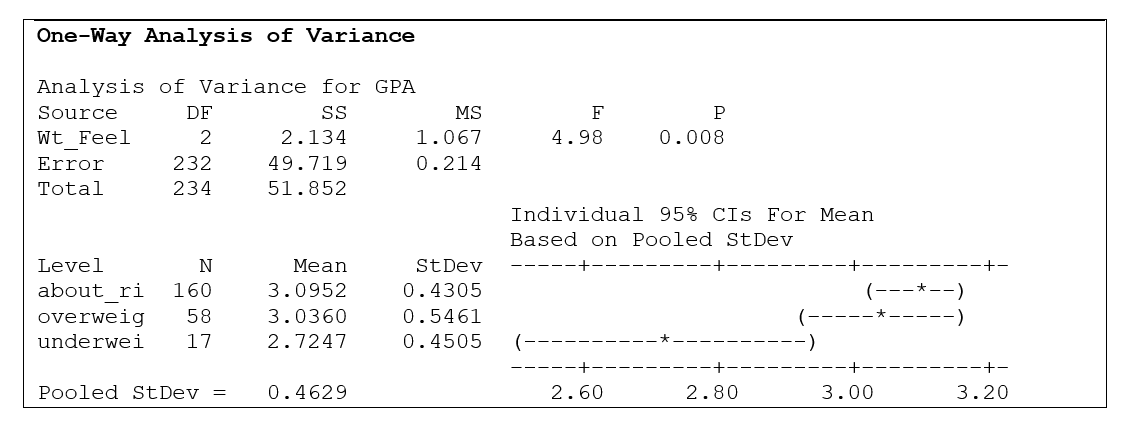 -What is the appropriate conclusion to draw from this analysis?
(Multiple Choice)
4.7/5 (26)
Use the following information for questions:
A student wanted to test whether there was a difference in the mean daily hours of study for students living in four different dormitories. She selected a random sample of 50 students from each of the four dormitories.
-What is the alternative hypothesis for this situation?
(Multiple Choice)
4.8/5 (42)
Use the following information for questions:
A company that owns five resort hotels wants to compare guest satisfaction across the hotels. For each hotel, the company's research department randomly sampled 21 people who had stayed at the hotel during the past month and asked them to rate their expectation of the hotel before their stay and to rate the quality of their actual stay at the hotel. Both observations used a rating scale of 0 to 10 with 0 = "very poor" and 10 = "excellent". For each guest, the researchers calculated a performance gap score, defined as the difference between a guest's prior expectation rating and actual quality rating.
-Identify the response variable and the explanatory variable.
(Short Answer)
4.8/5 (38)
Use the following information for questions:
A study compared weight loss among 5 different diet programs. A total sample size of 25 people was studied (5 people from each program) using one-way analysis of variance.
-What are the numerator and denominator degrees of freedom for the F-test?
(Multiple Choice)
4.8/5 (31)
When a one-way analysis of variance test is done, what probability distribution is used to find the p-value?
(Multiple Choice)
4.9/5 (34)
A one-way analysis of variance will be done to compare systolic blood pressures in three different age groups. What is the correct statement of the null hypothesis?
(Multiple Choice)
4.8/5 (37)
Use the following information for questions:
Five different training programs for improving endurance are compared. Forty individuals are randomly divided into five groups of n = 8 each and a different training program is assigned to each group. After two months, the improvement in endurance is recorded for each participant.
-The p-value in this situation would be found using
(Multiple Choice)
4.8/5 (36)
Use the following information for questions:
An experiment is conducted to compare the enthusiasm of participants performing two different tasks. Before starting the task, the personality type of the participants is determined. Two groups are then formed: one group of personality type A people and an equal size group of personality type B people. There were more type A people in the initial sample, so they were randomly sampled until the right number was reached. Then half of the participants in each group was given one of two tasks. The one task is easy and earns the participants $1. The other task is difficult and earns the participant $10. Part of the computer output is shown below.
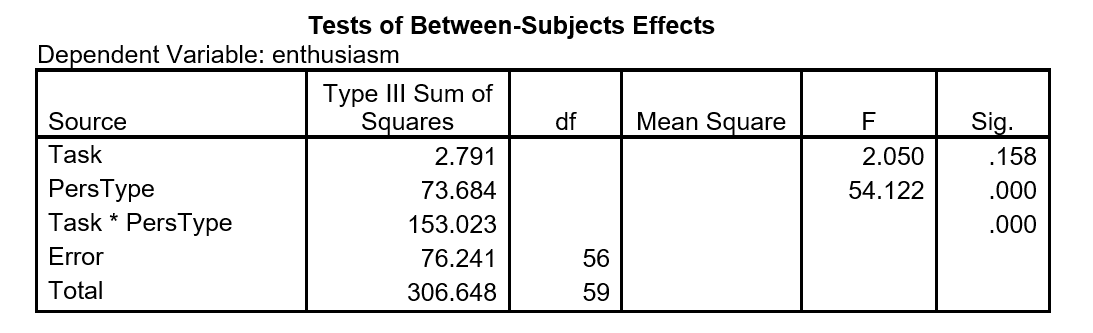 -How many degrees of freedom are associated with the F-statistic for the interaction effect?
(Multiple Choice)
4.9/5 (34)
Use the following information for questions:
A study compared grade point averages (GPA) among students in 4 different majors (English, History, Statistics, and Art) using analysis of variance. A total sample size of 20 students (5 in each major) was studied.
-The sum of squares for groups is SS Groups = 60. What is the Mean Square for groups (MS Groups)?
(Multiple Choice)
4.9/5 (36)
Use the following information for questions:
A shopper wanted to test whether there was a difference in the average waiting times at the check-out counter among 5 different supermarkets. She selected a random sample of 20 shoppers from each of the five supermarkets.
-What is the null hypothesis for this situation?
(Multiple Choice)
4.9/5 (31)
Use the following information for questions:
On a survey conducted at a university, students were asked how they felt about their weight (about right, overweight, or underweight), and also were asked to record their grade point average (GPA). There were 234 responses, with 160 saying their weight was about right, 50 said they were overweight, and 17 underweight. The question of interest is whether mean GPA is the same or differs for different weight attitude populations. Minitab output for the study is given below.
-The mean square for groups in this study is:
(Multiple Choice)
4.8/5 (38)
Use the following information for questions:
The following four graphs are profile plots obtained from a two-way analysis of variance where the response was compared between gender (male/female) and answer (yes/no). 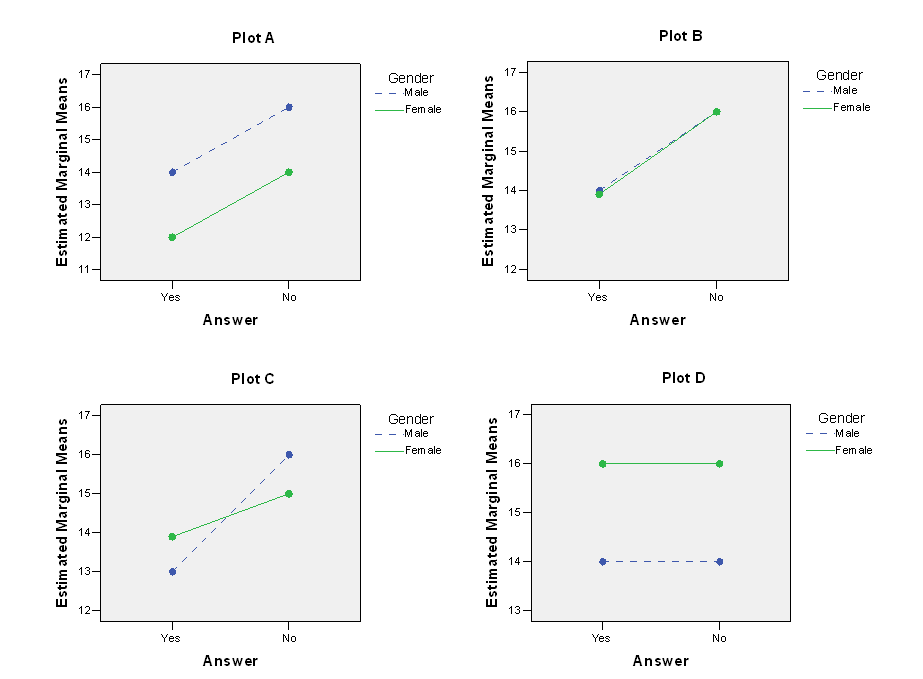 -Which of the four plots show a pattern of interaction?
(Multiple Choice)
4.8/5 (38)
Use the following information for questions:
A random sample of 235 students from University X is given a questionnaire about feelings. One of the questions was: "How do you feel about your height?" The answer categories were: too short, just about right, or too tall. A total feelings score is also calculated to measure the students' self worth. The results of theself worth score will be compared between the three groups defined by their feelings about their height andbetween boys and girl. The F-ratio for the interaction between feelings about height and gender is 4.98, with a p-value of 0.008.
-How is the p-value of 0.008 obtained?
(Multiple Choice)
4.9/5 (37)
Filters
- Essay(0)
- Multiple Choice(0)
- Short Answer(0)
- True False(0)
- Matching(0)