Exam 2: Summarizing Data: Listing and Grouping
Exam 1: Introduction37 Questions
Exam 2: Summarizing Data: Listing and Grouping63 Questions
Exam 3: Summarizing Data: Measures of Location57 Questions
Exam 4: Summarizing Data: Measures of Variation56 Questions
Exam 5: Possibilities and Probabilities63 Questions
Exam 6: Some Rules of Probability75 Questions
Exam 7: Expectations and Decisions49 Questions
Exam 8: Probability Distributions78 Questions
Exam 9: The Normal Distribution89 Questions
Exam 10: Sampling and Sampling Distributions61 Questions
Exam 11: Problems of Estimation13 Questions
Exam 12: Tests of Hypotheses: Means55 Questions
Exam 13: Tests of Hypotheses: Standard Deviations39 Questions
Exam 14: Tests of Hypotheses Based on Count Data43 Questions
Exam 15: Analysis of Variance49 Questions
Exam 16: Regression39 Questions
Exam 17: Correlation28 Questions
Exam 18: Nonparametric Tests41 Questions
Select questions type
The single number that best represents a given interval of a frequency distribution is called the _______.
(Short Answer)
4.8/5  (36)
(36)
A sample of 18 tries to connect to an online service using a phone line.
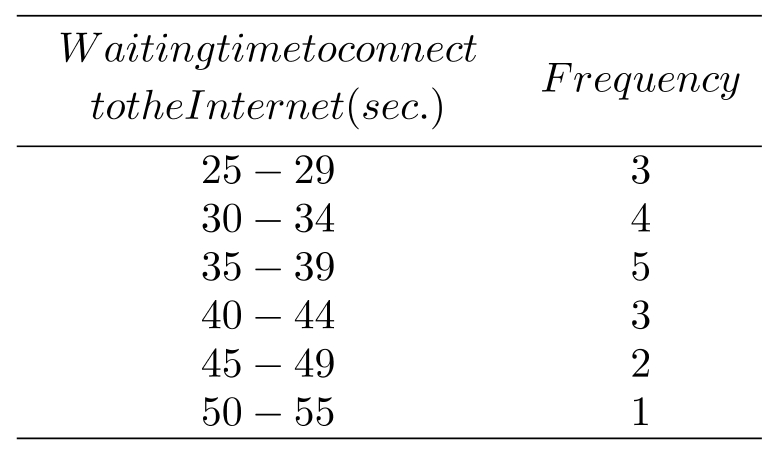 -If a cumulative "less than" distribution were constructed from the above frequency distribution, the cumulative frequency in the third row down would be
(Multiple Choice)
4.8/5 (28)
Table 1
A sample of 80 company employees is grouped into a table based on their weekly salaries:
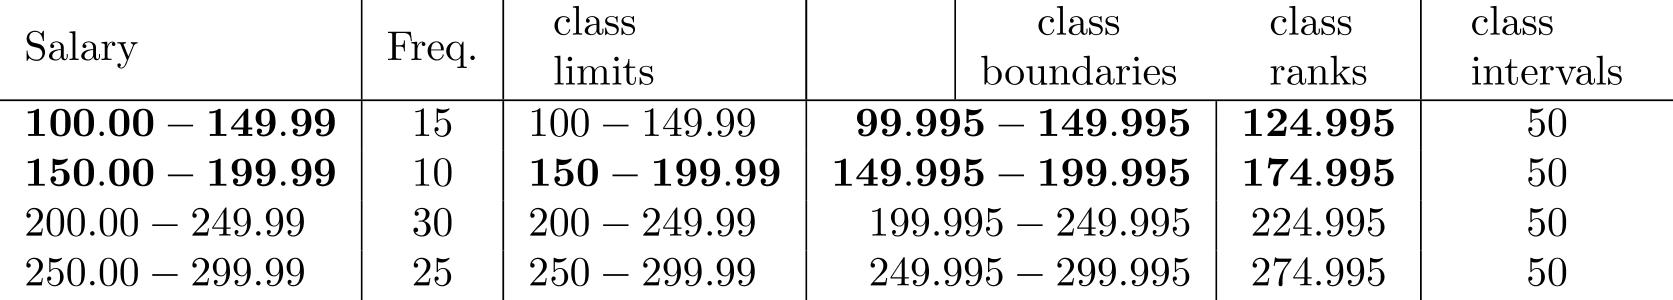 -From the data in Table 1, construct the cumulative "less than" distribution.
(Essay)
4.9/5 (39)
For the data below, construct a frequency histogram and a frequency polygon.
(Essay)
4.7/5 (39)
Frequency distributions are of two types: quantitative and qualitative.
(True/False)
4.8/5 (32)
In a software engineering class, the professor asked 48 students to name their favorite programming language. Their replies were Java, Perl, Perl, C++, Java, Lisp, Perl, Java, C++, Perl, Perl, Java, Smalltalk, Perl, Java, C++, Perl, Lisp, Perl, Perl, Java, Java, C++, Perl, Smalltalk, C++, Perl, Java, Lisp, Java, Perl, Perl, Perl, Smalltalk, C++, Java, Lisp, Perl, Java, Lisp, Java, Perl, Smalltalk, Java, Lisp, C++, Java, and Perl. Draw a bar chart with vertical bars for these categorical data.
(Essay)
4.7/5 (34)
To group data on the number of potential buyers entering an automobile dealer's showroom for a given week, the sales manager uses the classes , and 125-149. Explain what difficulties might arise.
(Essay)
4.9/5 (37)
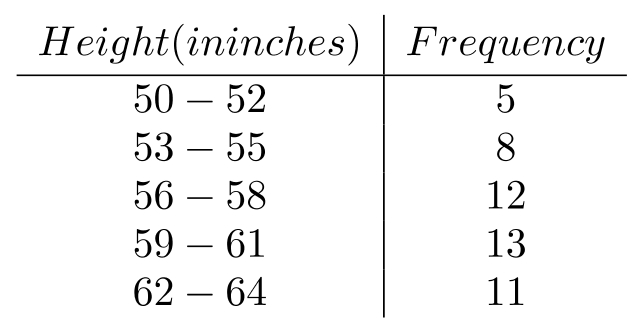
The heights (in inches) of 30 adult males are listed below. Construct a frequency histogram using five classes.
70 72 71 70 69 73 69 68 70 71
67 71 70 74 69 68 71 71 71 72
69 71 68 67 73 74 70 71 69 68
(Essay)
4.8/5 (30)
Which of the following would be a desirable property of a frequency distribution?
(Multiple Choice)
4.7/5 (44)
List the data which correspond to the following stem-and-leaf display.
3open vertical bar 6 2 5 7 2
(Short Answer)
4.8/5 (34)
The heights (in inches) of 30 adult males are listed below. Construct a frequency polygon using five classes.
70 72 71 70 69 73 69 68 70 71
67 71 70 74 69 68 71 71 71 72
69 71 68 67 73 74 70 71 69 68
(Essay)
4.8/5 (22)
Pie charts are graphical representations of _______ distributions.
(Short Answer)
4.9/5 (37)
A frequency polygon is a line graph of a cumulative frequency distribution.
(True/False)
4.7/5 (31)
An ogive of a cumulative "less than" distribution always decreases as we move from left to right.
(True/False)
4.8/5 (36)
We can show the proportion of values falling into various class intervals by using a _______ distribution.
(Multiple Choice)
4.9/5 (28)
Given the frequency distribution: 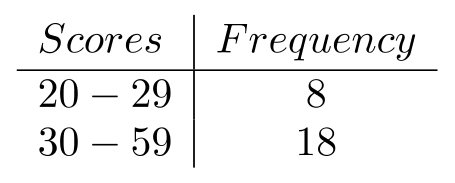 For the histogram of this distribution, the height of the 30-59 interval should be _______
(Multiple Choice)
5.0/5 (34)
One of the advantages of frequency distributions is that we can find the exact highest value in the data.
(True/False)
4.8/5 (33)
Following are the numbers of minutes it took 27 students to memorize two lists of German adjectives, one in the morning and one in the late afternoon.
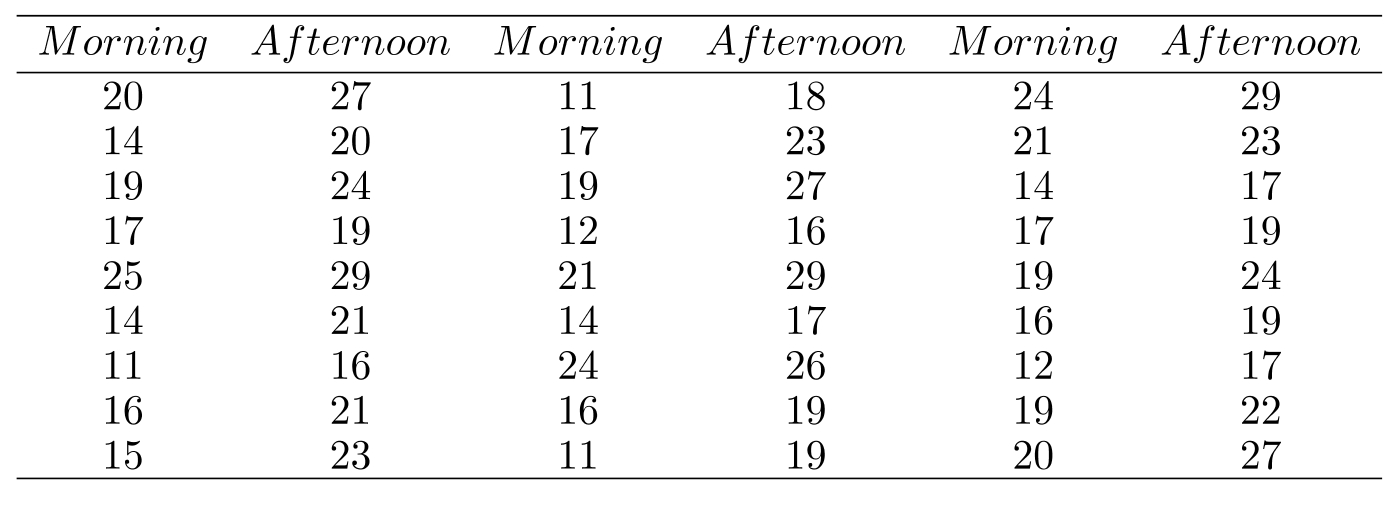 Produce a two-way frequency table for these data using the classes 10-14, 15-19, 20-24, and 25-29 for the morning, and the classes 15-19, 20-24, and 25-29 for the afternoon.
(Essay)
4.8/5 (32)
In a graph of frequency distribution with classes 10-19, 20-29, 30-59, and 60-69, explain why a histogram of the data might be misleading if all the heights of the rectangles are equal to the class frequencies.
(Essay)
4.8/5 (38)
Filters
- Essay(0)
- Multiple Choice(0)
- Short Answer(0)
- True False(0)
- Matching(0)