Exam 2: Summarizing Data: Listing and Grouping
Exam 1: Introduction37 Questions
Exam 2: Summarizing Data: Listing and Grouping63 Questions
Exam 3: Summarizing Data: Measures of Location57 Questions
Exam 4: Summarizing Data: Measures of Variation56 Questions
Exam 5: Possibilities and Probabilities63 Questions
Exam 6: Some Rules of Probability75 Questions
Exam 7: Expectations and Decisions49 Questions
Exam 8: Probability Distributions78 Questions
Exam 9: The Normal Distribution89 Questions
Exam 10: Sampling and Sampling Distributions61 Questions
Exam 11: Problems of Estimation13 Questions
Exam 12: Tests of Hypotheses: Means55 Questions
Exam 13: Tests of Hypotheses: Standard Deviations39 Questions
Exam 14: Tests of Hypotheses Based on Count Data43 Questions
Exam 15: Analysis of Variance49 Questions
Exam 16: Regression39 Questions
Exam 17: Correlation28 Questions
Exam 18: Nonparametric Tests41 Questions
Select questions type
It is possible for the class boundaries of an interval to be the same as its class limits.
(True/False)
4.8/5  (36)
(36)
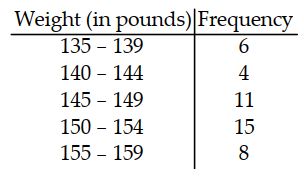
For the data below, construct a frequency histogram and a frequency polygon.
(Essay)
4.9/5 (35)
Table 1
A sample of 80 company employees is grouped into a table based on their weekly salaries:
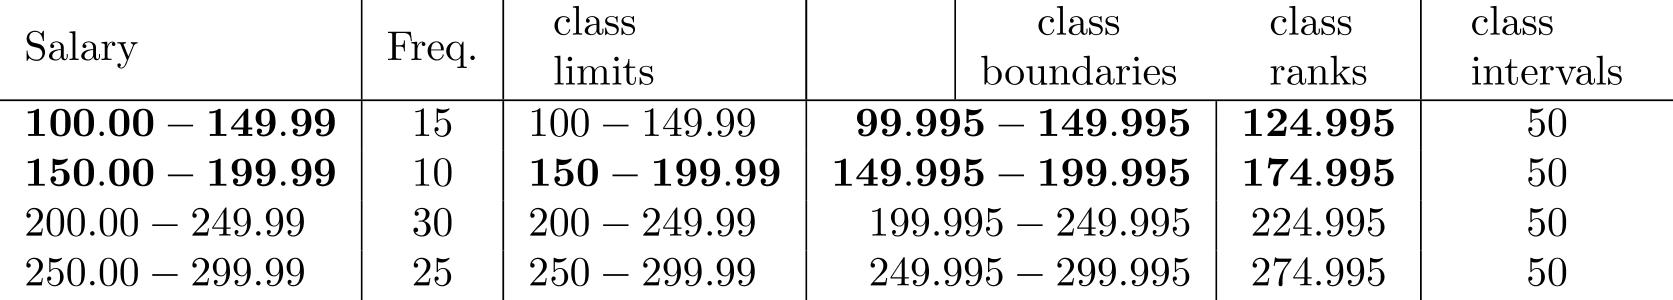 -From the data in Table 1, construct a cumulative "greater than" distribution.
(Essay)
4.9/5 (38)
The sum of the frequencies in a frequency distribution is equal to the number of elements in the sample.
(True/False)
4.9/5 (39)
In constructing a frequency distribution from raw data, there will usually be between _______ and _______ classes.
(Short Answer)
4.7/5 (33)
Table 1
A sample of 80 company employees is grouped into a table based on their weekly salaries:
-From the data in Table 1, construct a percentage distribution.
(Essay)
4.9/5 (27)
At a dairy products convention, an interviewer asked 40 persons to name their favorite dairy product. Their replies were ice cream, butter, cheese, butter, butter, milk, butter, sour cream, ice cream, cheese, butter, cheese, milk, cheese, butter, cheese, ice cream, butter, milk, butter, sour cream, ice cream, cheese, milk, butter, ice cream, cheese, butter, milk, sour cream, butter, cheese, milk, butter, cheese, milk, ice cream, sour cream, ice cream, and ice cream. Draw a bar chart with vertical bars for these categorical data.
(Essay)
4.9/5 (34)
The following are three daily pizza sales in units for a local pizza restaurant for the past two weeks:
-For this data, construct a stem-and-leaf display with one-digit leaves.
(Essay)
4.8/5 (49)
The grade point averages for 40 students are listed below. Construct an ogive using eight classes.
2.0 3.2 1.8 2.9 0.9 4.0 3.3 2.9 3.6 0.8
3.1 2.4 2.4 2.3 1.6 1.6 4.0 3.1 3.2 1.8
2.2 2.2 1.7 0.5 3.6 3.4 1.9 2.0 3.0 1.1
3.0 4.0 4.0 2.1 1.9 1.1 0.5 3.2 3.0 2.2
(Essay)
4.8/5 (36)
If two consecutive class intervals of a frequency distribution are 60-67 and 68-75, the class boundaries of the second interval are 68.95-75.95.
(True/False)
4.9/5 (38)
The heights (in inches) of 30 adult males are listed below. Construct a dot diagram for the data.
70 72 71 70 69 73 69 68 70 71
67 71 70 74 69 68 71 71 71 72
69 71 68 67 73 74 70 71 69 68
(Essay)
4.9/5 (36)
Solve the problem.
-Given the class marks 22, 30, 38, and 46, provide (i) class boundaries and (ii) class limits for this frequency distribution.
(Essay)
4.8/5 (32)
A sample of 18 tries to connect to an online service using a phone line.
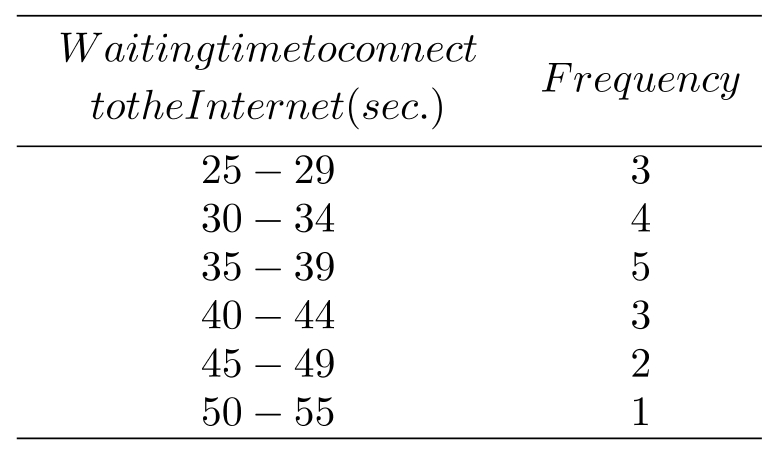 -The class boundaries of the second class are
(Multiple Choice)
4.9/5 (27)
For an ogive, the horizontal axis should contain the class _______
(Short Answer)
4.8/5 (36)
The heights (in inches) of 30 adult males are listed below. Construct a ogive using five classes.
70 72 71 70 69 73 69 68 70 71
67 71 70 74 69 68 71 71 71 72
69 71 68 67 73 74 70 71 69 68
(Essay)
4.9/5 (31)
List the data which correspond to the following stem-and-leaf display.
(Short Answer)
5.0/5 (40)
A sample of 18 tries to connect to an online service using a phone line.
-The numbers 40 and 44 are examples of
(Multiple Choice)
4.9/5 (48)
Filters
- Essay(0)
- Multiple Choice(0)
- Short Answer(0)
- True False(0)
- Matching(0)