Exam 2: Graphs, Lines, and Inequalities
Exam 1: Algebra and Equations409 Questions
Exam 2: Graphs, Lines, and Inequalities255 Questions
Exam 3: Functions and Graphs323 Questions
Exam 4: Exponential and Logarithmic Functions192 Questions
Exam 5: Mathematics of Finance183 Questions
Exam 6: Systems of Linear Equations and Matrices215 Questions
Exam 7: Linear Programming203 Questions
Exam 8: Sets and Probability240 Questions
Exam 9: Counting, Probability Distributions, and Further Topics in Probability210 Questions
Exam 10: Introduction to Statistics169 Questions
Exam 11: Differential Calculus342 Questions
Exam 12: Applications of the Derivative220 Questions
Exam 13: Integral Calculus227 Questions
Exam 14: Multivariate Calculus152 Questions
Select questions type
Solve the problem using your calculator.
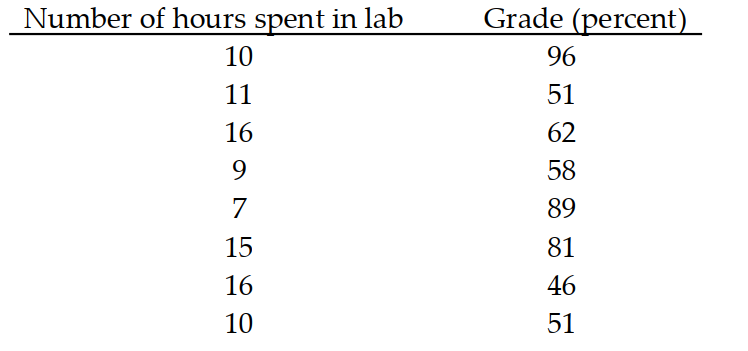
-A study was conducted to compare the average time spent in the lab each week versus course grade for computer students. The results are recorded in the table below. Use linear regression to find a linear function that predicts a student's course grade as a function of the number of hours spent in lab.
(Multiple Choice)
4.8/5  (44)
(44)
Solve the problem.
-A coin is tossed upward from a balcony high with an initial velocity of . During what interval of time will the coin be at a height of at least ? .
(Multiple Choice)
4.8/5 (27)
Write an equation in standard form for a line passing through the pair of points.
- and
(Multiple Choice)
4.8/5 (41)
Use a graphing calculator to find the graph of the equation.
- 
(Multiple Choice)
4.8/5 (37)
Write an equation in slope-intercept form of a line satisfying the given conditions.
- ;
(Multiple Choice)
4.7/5 (34)
Write an equation in slope-intercept form of a line satisfying the given conditions.
-
(Multiple Choice)
4.8/5 (34)
Find an equation of the the line satisfying the given conditions.
-Through (8,-2); parallel to
(Multiple Choice)
4.8/5 (32)
Use technology to compute , the correlation coefficient.
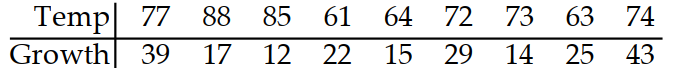
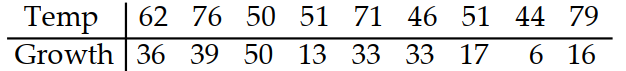
-The following are the temperatures on randomly chosen days and the amount a certain kind of plant grew (in millimeters):
(Multiple Choice)
4.8/5 (42)
Solve the problem.
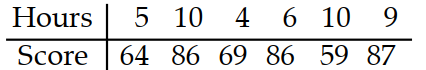
-The paired data below consist of the test scores of 6 randomly selected students and the number of hours they studied for the test. By using linear regression, the following equation is obtained: where is number of hours studied and is score on the test. Use this equation to predict the score on the test of a student who studies 14 hours.
(Multiple Choice)
4.8/5 (39)
Determine whether the given ordered pair is a solution of the given equation.
-
(True/False)
4.8/5 (43)
Find an equation of the the line satisfying the given conditions.
-Th rough the origin with slope 9
(Multiple Choice)
4.9/5 (29)
Find the x-intercepts and y-intercepts of the graph of the equation.
-
(Multiple Choice)
4.9/5 (30)
Solve the problem.
-The cost, , in dollars of car rental is , where is the number of miles driven. Graph the equation and use the graph to estimate the cost of car rental if the number of miles driven is 35 .

(Multiple Choice)
4.8/5 (32)
Find an equation of the line with slope m that passes through the given point. Put the answer in slope-intercept form.
-
(Multiple Choice)
4.8/5 (29)
Solve the problem.
-The paired data below consist of the temperatures on randomly chosen days and the amount a certain kind of plant grew (in millimeters). By using linear regression, the following equation is obtained: where is temperature and is growth in millimeters. Use this equation to predict the growth of a plant if the temperature is 79 .
(Multiple Choice)
4.8/5 (32)
Solve the problem.
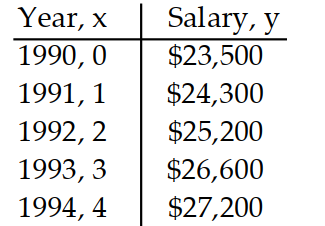
-The information in the chart gives the salary of a person for the stated years. Model the data with a linear equation using the points and .
(Multiple Choice)
4.9/5 (33)
Filters
- Essay(0)
- Multiple Choice(0)
- Short Answer(0)
- True False(0)
- Matching(0)