Exam 2: Graphs, Lines, and Inequalities
Exam 1: Algebra and Equations409 Questions
Exam 2: Graphs, Lines, and Inequalities255 Questions
Exam 3: Functions and Graphs323 Questions
Exam 4: Exponential and Logarithmic Functions192 Questions
Exam 5: Mathematics of Finance183 Questions
Exam 6: Systems of Linear Equations and Matrices215 Questions
Exam 7: Linear Programming203 Questions
Exam 8: Sets and Probability240 Questions
Exam 9: Counting, Probability Distributions, and Further Topics in Probability210 Questions
Exam 10: Introduction to Statistics169 Questions
Exam 11: Differential Calculus342 Questions
Exam 12: Applications of the Derivative220 Questions
Exam 13: Integral Calculus227 Questions
Exam 14: Multivariate Calculus152 Questions
Select questions type
Decide whether the pair of lines is parallel, perpendicular, or neither.
-
(Multiple Choice)
4.9/5  (40)
(40)
Find the x-intercepts and y-intercepts of the graph of the equation.
-
(Multiple Choice)
4.8/5 (36)
Solve the problem.
-In a lab experiment 17 grams of acid were produced in 16 minutes and 19 grams in 39 minutes. Let be the grams produced in minutes. Write an equation for grams produced.
(Multiple Choice)
4.8/5 (30)
Solve the inequality.
-
(Give approximations rounded to the nearest hundredth.)
(Multiple Choice)
4.8/5 (35)
Use technology to compute , the correlation coefficient.
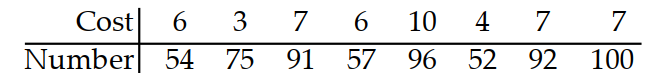
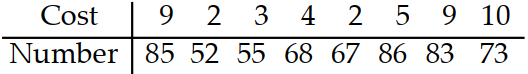
-The following are costs of advertising (in thousands of dollars) and the number of products sold (in thousands):
(Multiple Choice)
4.8/5 (43)
Find the x-intercepts and y-intercepts of the graph of the equation.
-
(Multiple Choice)
4.7/5 (40)
Use technology to compute , the correlation coefficient.
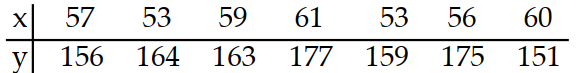
-Consider the data points with the following coordinates:
(Multiple Choice)
4.8/5 (40)
Use a graphing calculator to approximate all real solutions of the equation.
-
(Multiple Choice)
4.8/5 (23)
Solve the problem.
-The population , in thousands, of one town can be approximated by where is the number of years since 1985. Graph the equation and use the graph to estimate the population of the town in the year 1991.
(Multiple Choice)
4.7/5 (31)
Solve the problem.
-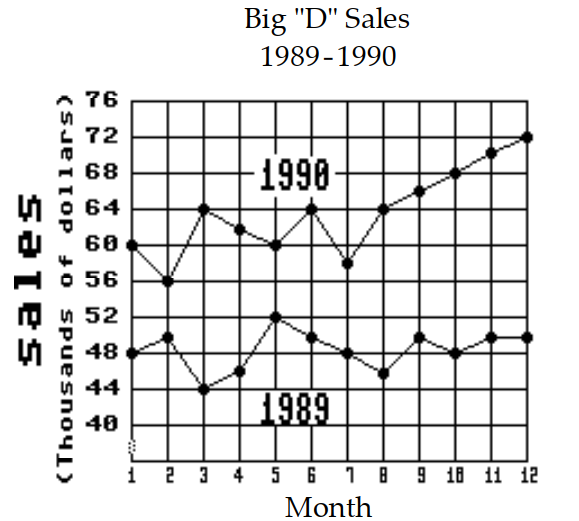 What was the increase in sales between month 5 and month 6 of 1990 ?
(Multiple Choice)
5.0/5 (31)
Solve the problem.
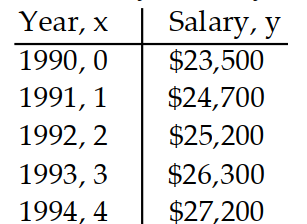
-The information in the chart below gives the salary of a person for the stated years. Model the data with a linear equation using the points and . Then use this equation to predict the salary for the year 2002 .
(Multiple Choice)
4.9/5 (34)
Decide whether the pair of lines is parallel, perpendicular, or neither.
-
(Multiple Choice)
4.9/5 (38)
Solve the problem.
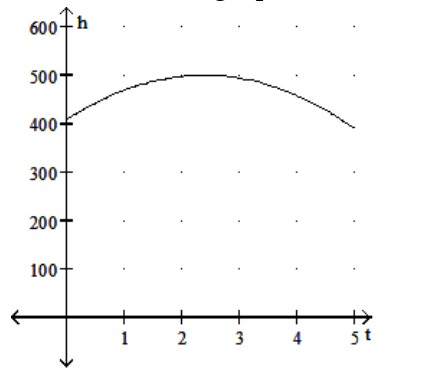
-The height in feet of a projectile thrown upward from the roof of a building after time seconds is shown in the graph below. How high will the projectile be after ?
(Multiple Choice)
4.8/5 (42)
Use a graphing calculator to find the graph of the equation.
-
(Multiple Choice)
4.9/5 (34)
Solve the problem using your calculator.
-The paired data below consist of the costs of advertising (in thousands of dollars) and the number of products sold (in thousands). Use linear regression to find a linear function that predicts the number of products sold as a function of the cost of advertising.
(Multiple Choice)
4.9/5 (40)
Solve the problem.
-The cost of producing units is , and the revenue generated from sales is . Determine the number of units to be sold in order to generate a profit.
(Multiple Choice)
4.9/5 (39)
Filters
- Essay(0)
- Multiple Choice(0)
- Short Answer(0)
- True False(0)
- Matching(0)