Exam 7: Variation in Repeated Samplessampling Distributions
Exam 1: Introduction to Statistics17 Questions
Exam 2: Organization and Description of Data53 Questions
Exam 3: Descriptive Study of Bivariate Data44 Questions
Exam 4: Probability54 Questions
Exam 5: Probability Distributions49 Questions
Exam 6: The Normal Distribution32 Questions
Exam 7: Variation in Repeated Samplessampling Distributions31 Questions
Exam 8: Drawing Inferences From Large Samples48 Questions
Exam 9: Small Sample Inferences for Normal Populations36 Questions
Exam 10: Comparing Two Treatments37 Questions
Exam 11: Regression Analysis I29 Questions
Exam 12: Regression Analysis II Multiple Linear Regression and Other Topics5 Questions
Exam 13: Analysis of Categorical Data19 Questions
Exam 14: Analysis of Variance Anova16 Questions
Exam 15: Nonparametric Inference15 Questions
Select questions type
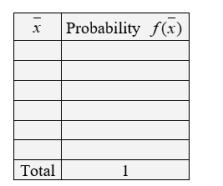
From the set of numbers {5, 9, 15}, a random sample of size two will be selected with replacement. Determine the sampling distribution of X̄, that is, complete the following table. (Write the probabilities as fractions.)
(Essay)
4.9/5  (30)
(30)
Suppose the number of passengers in a bus, going from New York City to Washington D.C., is approximately normal with mean 30.4 passengers and standard deviation 1.1 passengers. What proportion of the busses travel with less than 30 passengers?
(Short Answer)
5.0/5 (43)
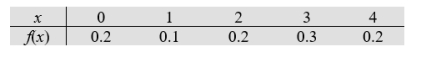
The daily number of persons who file complaints about the food quality at one fast food location has probability distribution
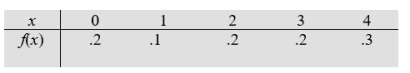 Find the standard deviation of the number of complaints. Round your answer to one decimal place.
(Short Answer)
4.9/5 (36)
The number of students per classroom in a mid-size college is a random variable whose distribution is normal with mean 34 students and standard deviation 4 students. You intend to visit twenty five classrooms, what is the probability that the average number of students per room will be greater than 35.3 students?
(Multiple Choice)
4.9/5 (35)
Take a random sample of size n = 2, without replacement, from
{0, 2, 4, 6}. Let = mean of the two numbers selected.
(a) List the six possible amples and the associated value of the sample mean.
(b) Construct the sampling distribution of .
(c) Obtain the expected value of using the sampling distribu- tion in Part b.
(d) Obtain the variance of using the sampling distribution in Part b.
(Essay)
4.8/5 (35)
A population has distribution
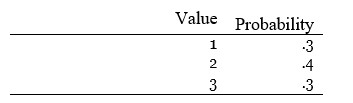 Let X1 and X2 be independent and each have the same distribution as the population.
(a) Find the expected value and variance of X1.
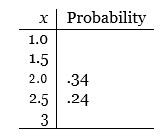
(b) Determine the missing elements in the table for the sampling distribution of = (X1 + X2) / 2
Let X1 and X2 be independent and each have the same distribution as the population.
(a) Find the expected value and variance of X1.
(b) Determine the missing elements in the table for the sampling distribution of = (X1 + X2) / 2
 (c) Find the expected value and variance of .
(d) If the sample size is increased to 25, give the mean and variance of
(c) Find the expected value and variance of .
(d) If the sample size is increased to 25, give the mean and variance of
(Essay)
4.7/5 (38)
In a recent year, 70% of the world's largest companies were foreign
(Multiple Choice)
4.8/5 (34)
A random sample of size 225 is taken from the population of the ages of seniors enrolled at a large university one semester. This population has mean 22.3 years and standard deviation 2.5. The population distribution is not normal.
(a) Is it reasonable to assume a normal distribution for the sample mean Why or why not?
(b) Find the probability that lies between 22.1 and 22.5 years.
(c) Find the probability that exceeds 22.7 years.
(Essay)
4.8/5 (33)
The daily number of persons who file complaints about the food quality at one fast food
location has probability distribution
 What is the approximate probability that this fast food location will receive more than 140 complaints in a period of 100 days?
(Short Answer)
4.7/5 (38)
The heights of male students at a university have a nearly normal distribution with
mean 70.5 inches and standard deviation 2.8 inches. If 5 male students are randomly
selected to make up an intramural basketball team, what is the probability that the
heights of the team averages over 72.0 inches?
(Short Answer)
4.9/5 (38)
Filters
- Essay(0)
- Multiple Choice(0)
- Short Answer(0)
- True False(0)
- Matching(0)