Exam 1: Getting Started
Exam 1: Getting Started337 Questions
Exam 2: The Us and Global Economies201 Questions
Exam 3: The Economic Problem273 Questions
Exam 4: Demand and Supply322 Questions
Exam 5: Elasticities of Demand and Supply335 Questions
Exam 6: Efficiency and Fairness of Markets352 Questions
Exam 7: Government Actions in Markets349 Questions
Exam 8: Global Markets in Action276 Questions
Exam 9: Externalities: Pollution, Education, and Health Care290 Questions
Exam 10: Production and Cost266 Questions
Exam 11: Perfect Competition275 Questions
Exam 12: Monopoly377 Questions
Exam 13: Monopolistic Competition and Oligopoly316 Questions
Exam 14: Gdp: a Measure of Total Production and Income253 Questions
Exam 15: Jobs and Unemployment283 Questions
Exam 16: The Cpi and the Cost of Living263 Questions
Exam 17: Potential Gdp and Economic Growth328 Questions
Exam 18: Money and the Monetary System360 Questions
Exam 19: Aggregate Supply and Aggregate Demand301 Questions
Exam 20: Fiscal Policy and Monetary Policy223 Questions
Select questions type
In the above, which figure shows both a positive and a negative relationship between the variables?
(Multiple Choice)
4.9/5  (35)
(35)
Which of the following statements is true regarding scarcity?
(Multiple Choice)
5.0/5 (24)
1.5 Chapter Figures
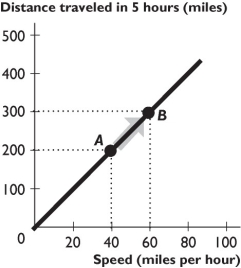 -The relationship between distance traveled in 5 hours and speed shown in the figure above is
(Multiple Choice)
4.8/5 (37)
A graph of two variables is a vertical line. What is the interpretation of this result?
(Essay)
4.7/5 (44)
Why is the benefit of something measured by what you are willing to give up?
(Essay)
4.9/5 (41)
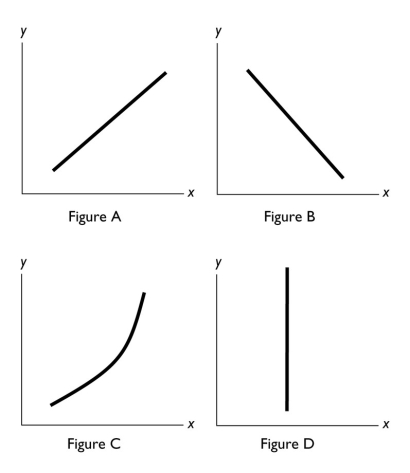 -In the diagram above, which figure(s)show(s)an inverse relationship between the variables?
(Multiple Choice)
5.0/5 (43)
You have data for sales of pizza for each of the 50 states in 2011. The type of graph to best display these data would be a
(Multiple Choice)
4.9/5 (44)
When Ford decides to increase production of hybrid cars, it directly answers the ________ question.
(Multiple Choice)
4.8/5 (37)
In the above, which figure(s)has at least one point at which the slope equals zero?
(Multiple Choice)
4.8/5 (30)
A steep slope in a time series graph means the variable is
(Multiple Choice)
4.9/5 (33)
A professor changes the penalty for cheating on exams from getting a 0 on the exam to getting an F in the course. The professor has
(Multiple Choice)
4.9/5 (36)
Explain whether the statement "The government should increase tariffs on Japanese cars to protect the American car industry from competition," is a normative or positive statement.
(Essay)
4.8/5 (31)
The slope of a line equals the change in the variable measured along the
(Multiple Choice)
4.7/5 (27)
Filters
- Essay(0)
- Multiple Choice(0)
- Short Answer(0)
- True False(0)
- Matching(0)