Exam 1: Getting Started
Exam 1: Getting Started337 Questions
Exam 2: The Us and Global Economies201 Questions
Exam 3: The Economic Problem273 Questions
Exam 4: Demand and Supply322 Questions
Exam 5: Elasticities of Demand and Supply335 Questions
Exam 6: Efficiency and Fairness of Markets352 Questions
Exam 7: Government Actions in Markets349 Questions
Exam 8: Global Markets in Action276 Questions
Exam 9: Externalities: Pollution, Education, and Health Care290 Questions
Exam 10: Production and Cost266 Questions
Exam 11: Perfect Competition275 Questions
Exam 12: Monopoly377 Questions
Exam 13: Monopolistic Competition and Oligopoly316 Questions
Exam 14: Gdp: a Measure of Total Production and Income253 Questions
Exam 15: Jobs and Unemployment283 Questions
Exam 16: The Cpi and the Cost of Living263 Questions
Exam 17: Potential Gdp and Economic Growth328 Questions
Exam 18: Money and the Monetary System360 Questions
Exam 19: Aggregate Supply and Aggregate Demand301 Questions
Exam 20: Fiscal Policy and Monetary Policy223 Questions
Select questions type
The question "Should we produce LCD televisions or computer monitors? " is an example of a ________ question.
(Multiple Choice)
4.8/5  (39)
(39)
Rather than go out to eat by yourself, you decide to stay at home and fix dinner for yourself and your two roommates. Your roommates applaud your decision. Your roommates tell you that your decision to eat at home has no opportunity cost because you already have all the dinner ingredients in your pantry. Is this comment correct?
(Essay)
4.9/5 (42)
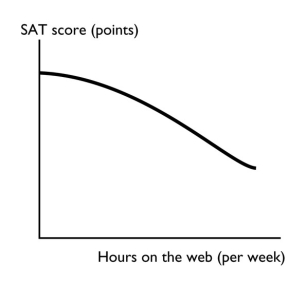 -The figure above shows how the relationship between the number of hours per week a high school student spends on the web and the student's SAT score. Is the relationship between hours on the web and the SAT score positive, negative, neither?
Explain your answer.
-The figure above shows how the relationship between the number of hours per week a high school student spends on the web and the student's SAT score. Is the relationship between hours on the web and the SAT score positive, negative, neither?
Explain your answer.
(Essay)
5.0/5 (41)
The marginal benefit of an activity is i. the benefit from a one-unit increase in the activity
Ii. the benefit of a small, unimportant activity.
Iii. measured by what the person is willing to give up to get one additional unit of the activity.
(Multiple Choice)
4.9/5 (39)
To show the values of an economic variable for different groups in a population at a point in time, it is best to use a
(Multiple Choice)
4.9/5 (38)
The question of "How are goods and services produced? " most closely addresses which of the following issues?
(Multiple Choice)
4.8/5 (33)
To graph a relationship involving more than two variables, we use which assumption?
(Multiple Choice)
4.8/5 (34)
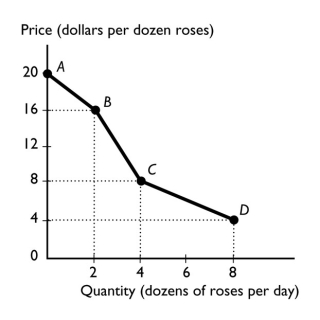 -The figure above shows the relationship between the price of a dozen roses and the quantity of roses a florist can sell. The slope between points A and B is
(Multiple Choice)
4.9/5 (46)
Most economic graphs have two lines perpendicular to each other. Where these lines met is called the
(Multiple Choice)
4.9/5 (36)
A graph shows the average wage of various demographic groups in 2012. The kind of graph used to show these data would be a
(Multiple Choice)
4.9/5 (38)
Filters
- Essay(0)
- Multiple Choice(0)
- Short Answer(0)
- True False(0)
- Matching(0)