Exam 1: Getting Started
Exam 1: Getting Started337 Questions
Exam 2: The Us and Global Economies201 Questions
Exam 3: The Economic Problem273 Questions
Exam 4: Demand and Supply322 Questions
Exam 5: Elasticities of Demand and Supply335 Questions
Exam 6: Efficiency and Fairness of Markets352 Questions
Exam 7: Government Actions in Markets349 Questions
Exam 8: Global Markets in Action276 Questions
Exam 9: Externalities: Pollution, Education, and Health Care290 Questions
Exam 10: Production and Cost266 Questions
Exam 11: Perfect Competition275 Questions
Exam 12: Monopoly377 Questions
Exam 13: Monopolistic Competition and Oligopoly316 Questions
Exam 14: Gdp: a Measure of Total Production and Income253 Questions
Exam 15: Jobs and Unemployment283 Questions
Exam 16: The Cpi and the Cost of Living263 Questions
Exam 17: Potential Gdp and Economic Growth328 Questions
Exam 18: Money and the Monetary System360 Questions
Exam 19: Aggregate Supply and Aggregate Demand301 Questions
Exam 20: Fiscal Policy and Monetary Policy223 Questions
Select questions type
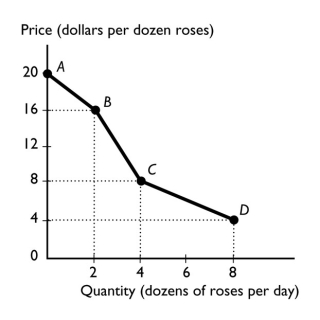 -The figure above shows the relationship between the price of a dozen roses and the quantity of roses a florist can sell. The relationship between the price and the quantity the florist can sell is
(Multiple Choice)
4.7/5  (24)
(24)
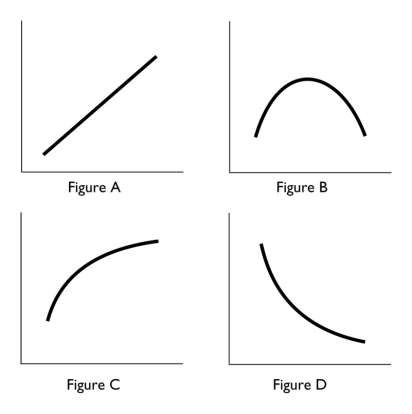 -In the above, which figure(s)show relationship between the variables that is always positive?
(Multiple Choice)
4.9/5 (37)
"Lower ticket prices would lead to more people attending ballgames." This statement is a
(Multiple Choice)
4.9/5 (31)
When economists use the term "correlation," they are referring to
(Multiple Choice)
4.9/5 (44)
Whenever one variable increases, another variable decreases. The two variables are
(Multiple Choice)
5.0/5 (38)
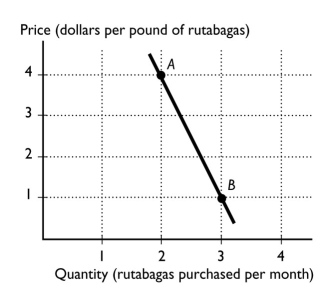 -In the figure above, between points A and B, what is the slope of the line?
(Multiple Choice)
4.9/5 (38)
Which of the following statements best describes the study of economics? Economics studies how
(Multiple Choice)
4.9/5 (38)
Choices that are best for the individuals that make them are choices in pursuit of
(Multiple Choice)
4.8/5 (27)
As a shoe factory adds more workers, shoe production grows, reaches a maximum, and then shrinks. In a diagram that has the number of workers on the horizontal axis and the number of shoes on the vertical axis, the relationship between the number of workers and the number of shoes starts as ________ and then, after the maximum point, is ________.
(Multiple Choice)
4.9/5 (39)
A graph that shows how the amount of advertising expenditure differs among various industries can be shown
(Multiple Choice)
4.8/5 (44)
 -In the above figure, a negative relationship between x and y is shown in Figure
(Multiple Choice)
4.8/5 (37)
To show how a variable ________, we typically use a ________.
(Multiple Choice)
4.8/5 (40)
Demonstrating how an economic variable changes from one year to the next is best illustrated by a
(Multiple Choice)
4.9/5 (42)
The question "Will doctors or lawyers have higher annual incomes?
" represents which of the three basic economic questions?
(Essay)
5.0/5 (34)
In the above, which figure(s)show a relationship between the variables that is always negative?
(Multiple Choice)
4.8/5 (40)
Filters
- Essay(0)
- Multiple Choice(0)
- Short Answer(0)
- True False(0)
- Matching(0)