Exam 1: Getting Started
Exam 1: Getting Started337 Questions
Exam 2: The Us and Global Economies201 Questions
Exam 3: The Economic Problem273 Questions
Exam 4: Demand and Supply322 Questions
Exam 5: Elasticities of Demand and Supply335 Questions
Exam 6: Efficiency and Fairness of Markets352 Questions
Exam 7: Government Actions in Markets349 Questions
Exam 8: Global Markets in Action276 Questions
Exam 9: Externalities: Pollution, Education, and Health Care290 Questions
Exam 10: Production and Cost266 Questions
Exam 11: Perfect Competition275 Questions
Exam 12: Monopoly377 Questions
Exam 13: Monopolistic Competition and Oligopoly316 Questions
Exam 14: Gdp: a Measure of Total Production and Income253 Questions
Exam 15: Jobs and Unemployment283 Questions
Exam 16: The Cpi and the Cost of Living263 Questions
Exam 17: Potential Gdp and Economic Growth328 Questions
Exam 18: Money and the Monetary System360 Questions
Exam 19: Aggregate Supply and Aggregate Demand301 Questions
Exam 20: Fiscal Policy and Monetary Policy223 Questions
Select questions type
In a graph, a straight line has a negative slope if the line
(Multiple Choice)
4.9/5  (40)
(40)
X Y 2 20 4 16 6 12 8 8
-Graph the data in the table above in the figure. Label the axes.
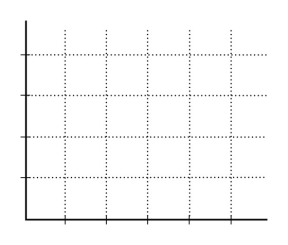 a. Is the relationship between X and Y positive or negative?
b. What is the slope when X = 4?
c. What is the slope when X = 8?
a. Is the relationship between X and Y positive or negative?
b. What is the slope when X = 4?
c. What is the slope when X = 8?
(Essay)
4.9/5 (42)
When unskilled teens earn less than college graduates, society answers the ________ question.
(Multiple Choice)
4.8/5 (34)
A graph has a point that is either a maximum or a minimum. To the left of the point, the slope of relationship is positive. To the right of the point, the slope is negative. Is the point a maximum point or a minimum point?
Be sure to draw a figure that supports your answer.
(Essay)
4.7/5 (41)
The decision to go to graduate school is a rational one for a college student if the
(Multiple Choice)
4.8/5 (38)
What is the reason that all economic issues and problems occur?
(Multiple Choice)
4.9/5 (44)
The figure above shows the relationship between the time a student spends studying and the student's GPA that semester. The slope of the relationship at point A ________ the slope at point B.
(Multiple Choice)
4.7/5 (41)
Shaniq can spend the next hour studying for a finance test, hiking along the Oregon coast, watching reruns of Lost on television, or napping. If she decides to study, what is the opportunity cost of her choice: hiking, watching television, or napping?
(Essay)
4.8/5 (37)
Katie's Income (dollars per year) Katie's purchases (books per year) 50,000 14 70,000 16 90,000 18 110,000 20
-The table above shows how the number of books Katie buys each year depends on her income
a. What kind of relationship exists between Katie's income and the number of books she purchases?
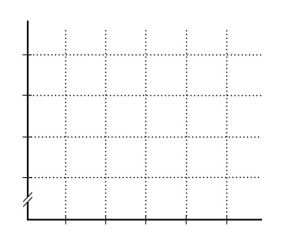 b. Plot the relationship between Katie's income and the number of books she purchases in the above figure. Measure income along the vertical axis and the number of books along the horizontal axis. Be sure to label the axes.
c. What is the slope of the relationship between $50,000 and $70,000 of income?
d. What is the slope of the relationship between $90,000 and $110,000 of income?
e. Comment on the similarity or dissimilarity of your answers to parts (c)and (d).
b. Plot the relationship between Katie's income and the number of books she purchases in the above figure. Measure income along the vertical axis and the number of books along the horizontal axis. Be sure to label the axes.
c. What is the slope of the relationship between $50,000 and $70,000 of income?
d. What is the slope of the relationship between $90,000 and $110,000 of income?
e. Comment on the similarity or dissimilarity of your answers to parts (c)and (d).
(Essay)
4.7/5 (38)
Suppose you eat two hamburgers for lunch. The marginal benefit of the first burger is ________ of the second burger.
(Multiple Choice)
4.8/5 (38)
Filters
- Essay(0)
- Multiple Choice(0)
- Short Answer(0)
- True False(0)
- Matching(0)