Exam 1: Getting Started
Exam 1: Getting Started337 Questions
Exam 2: The Us and Global Economies201 Questions
Exam 3: The Economic Problem273 Questions
Exam 4: Demand and Supply322 Questions
Exam 5: Elasticities of Demand and Supply335 Questions
Exam 6: Efficiency and Fairness of Markets352 Questions
Exam 7: Government Actions in Markets349 Questions
Exam 8: Global Markets in Action276 Questions
Exam 9: Externalities: Pollution, Education, and Health Care290 Questions
Exam 10: Production and Cost266 Questions
Exam 11: Perfect Competition275 Questions
Exam 12: Monopoly377 Questions
Exam 13: Monopolistic Competition and Oligopoly316 Questions
Exam 14: Gdp: a Measure of Total Production and Income253 Questions
Exam 15: Jobs and Unemployment283 Questions
Exam 16: The Cpi and the Cost of Living263 Questions
Exam 17: Potential Gdp and Economic Growth328 Questions
Exam 18: Money and the Monetary System360 Questions
Exam 19: Aggregate Supply and Aggregate Demand301 Questions
Exam 20: Fiscal Policy and Monetary Policy223 Questions
Select questions type
Proponents of cuts in income tax rates argue that when income tax rates are cut, workers have an incentive to increase their work hours. This argument is based on the assumption that
(Multiple Choice)
4.8/5  (33)
(33)
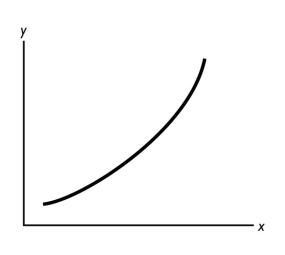 -In the figure above, what can you deduce about the slope of the curve?
(Essay)
4.7/5 (40)
Which of the following statements is a normative statement?
(Multiple Choice)
4.9/5 (33)
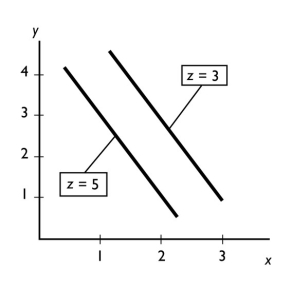 -In the figure above, ceteris paribus, an increase in x is associated with
(Multiple Choice)
4.8/5 (45)
"The change in the value of the variable measured on the y-axis divided by the change in the value of the variable measured on the x-axis" is the definition of
(Multiple Choice)
4.9/5 (30)
Economics is best defined as the social science that studies
(Multiple Choice)
4.8/5 (37)
"It is impossible to represent a three variable relationship in a two-dimensional graph." Is this statement true or false?
Explain your answer.
(Essay)
4.8/5 (30)
Consider a diagram in which the variable measured on the y-axis remains constant while the variable measured on the x-axis increases. The graph of these two variables is a
(Multiple Choice)
4.7/5 (32)
Canada has nationalized health care, so that everyone, regardless of their ability to pay, has some access to health care. Based on this observation, Canada has decided that "everyone, regardless of their ability to pay" is the answer to what microeconomic question?
(Multiple Choice)
4.8/5 (41)
A graph showing the values of an economic variable for different groups in a population at a point in time is called a
(Multiple Choice)
4.8/5 (32)
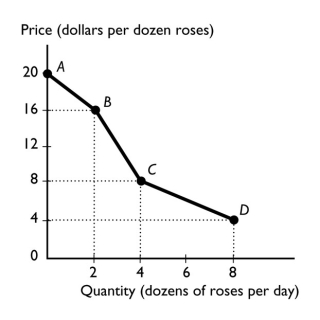 -The figure above shows the relationship between the price of a dozen roses and the quantity of roses a florist can sell. The slope between points B and C equals
(Multiple Choice)
4.9/5 (42)
Suppose that, instead of taking this test, you could either have worked and earned income or partied and had a pleasurable time. Your opportunity cost of taking the test is the
(Multiple Choice)
4.9/5 (37)
Mothers Against Drunk Drivers (MADD)campaigned to increase the legal penalties of drunk driving. This successful campaign ________ of drunk driving.
(Multiple Choice)
4.9/5 (48)
 -To graph a relationship that involves more than two variables, we use
(Multiple Choice)
4.7/5 (42)
Filters
- Essay(0)
- Multiple Choice(0)
- Short Answer(0)
- True False(0)
- Matching(0)