Exam 14: Macroeconomics in an Open Economy
Exam 1: Economics: Foundations and Models148 Questions
Exam 2: Trade-Offs, Comparative Advantage, and the Market System314 Questions
Exam 3: Where Prices Come From: The Interaction of Supply and Demand314 Questions
Exam 4: GDP: Measuring Total Production and Income277 Questions
Exam 5: Unemployment and Inflation300 Questions
Exam 6: Economic Growth, The Financial System, and Business Cycles262 Questions
Exam 7: Long-Run Economic Growth: Sources and Policies280 Questions
Exam 8: Aggregate Expenditure and Output in the Short Run315 Questions
Exam 9: Aggregate Demand and Aggregate Supply Analysis246 Questions
Exam 10: Money, Banks, and the Bank of Canada285 Questions
Exam 11: Monetary Policy281 Questions
Exam 12: Fiscal Policy303 Questions
Exam 13: Inflation, Unemployment, and Bank of Canada Policy265 Questions
Exam 14: Macroeconomics in an Open Economy280 Questions
Exam 15: The International Financial System228 Questions
Select questions type
Which of the following would increase net exports in Canada?
(Multiple Choice)
4.8/5  (41)
(41)
If there is currently a shortage of dollars, which of the following would you expect to see in the foreign exchange market?
(Multiple Choice)
4.8/5 (46)
If net foreign investment is positive, which of the following must be true? (Assume that the capital account is zero and net transfers are zero.)
(Multiple Choice)
4.7/5 (37)
Does the saving and investment equation imply that a country's national saving must always equal its domestic investment? Explain.
(Essay)
4.8/5 (38)
The Canadian ________ account records relatively minor transactions, such as migrants' transfers; and sales and purchases of nonproduced, nonfinancial assets.
(Multiple Choice)
4.9/5 (34)
Figure 14.1  Alt text for Figure 14.1: In figure 14.1, a graph illustrates the quantity of dollars traded against the exchange rate.
Long description for Figure 14.1: The x-axis is labelled, quantity of dollars traded, and the y-axis is labelled, exchange rate, euros against dollars.2 supply curves; S1 and S2, and two demand curves; D1 and D2 are plotted.Supply curve S1 is a straight line which slopes up from the bottom left corner to the top left corner, and passes through points A and B.Supply curve S2 is a straight line with the same slope as S1, but plotted above.S2 passes through points D and C.Demand curve D1 is a straight line, which slopes down from the top left corner to the bottom right corner.Curve D1 intersects curve S1 at point A, and curve S2 at point D.Demand curve D2 is a straight line with the same slope as D1, but plotted above.Curve D2 intersects curve S1 at point B, and curve S2 at point C.
-Refer to Figure 14.1.The appreciation of the euro is represented as a movement from
Alt text for Figure 14.1: In figure 14.1, a graph illustrates the quantity of dollars traded against the exchange rate.
Long description for Figure 14.1: The x-axis is labelled, quantity of dollars traded, and the y-axis is labelled, exchange rate, euros against dollars.2 supply curves; S1 and S2, and two demand curves; D1 and D2 are plotted.Supply curve S1 is a straight line which slopes up from the bottom left corner to the top left corner, and passes through points A and B.Supply curve S2 is a straight line with the same slope as S1, but plotted above.S2 passes through points D and C.Demand curve D1 is a straight line, which slopes down from the top left corner to the bottom right corner.Curve D1 intersects curve S1 at point A, and curve S2 at point D.Demand curve D2 is a straight line with the same slope as D1, but plotted above.Curve D2 intersects curve S1 at point B, and curve S2 at point C.
-Refer to Figure 14.1.The appreciation of the euro is represented as a movement from
(Multiple Choice)
4.8/5 (46)
Which of the following would decrease the balance on the current account?
(Multiple Choice)
4.9/5 (39)
If net foreign investment in Canada is negative, how must national saving and domestic investment be related?
(Multiple Choice)
4.8/5 (40)
According to the saving and investment equation, if net foreign investment rises by $60 million,
(Multiple Choice)
4.8/5 (33)
The price of domestic goods in terms of foreign goods is referred to as
(Multiple Choice)
4.7/5 (36)
Monetary policy has a ________ effect on aggregate demand in a(n)________ economy, and fiscal policy has a ________ effect on aggregate demand in a(n)________ economy.
(Multiple Choice)
4.7/5 (30)
If the exchange rate between the Mexican peso and dollar expressed in terms of pesos per dollar is 13.5 pesos = 1 dollar, what is the exchange rate when expressed in terms of dollars per peso?
(Essay)
4.9/5 (39)
Which of the following would decrease the current account balance of Canada?
(Multiple Choice)
5.0/5 (29)
Figure 14.4 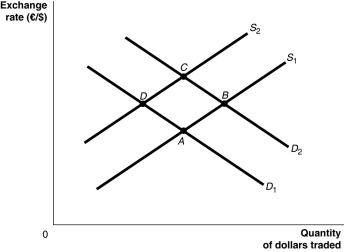 Alt text for Figure 14.4: In figure 14.4, a graph illustrates the quantity of dollars traded against the exchange rate.
Long description for Figure 14.4: The x-axis is labelled, quantity of dollars traded, and the y-axis is labelled, exchange rate, euros against dollars.2 supply curves; S1 and S2, and 2 demand curves; D1 and D2 are plotted.Supply curve S1 is a straight line which slopes up from the bottom left corner to the top right corner.It passes through points A and B.Supply curve S2 is a straight line with the same slope as curve S1, but is plotted to the right.Curve S2 passes through points D and C.Demand curve D1 is a straight line which slopes down from the top left corner to the bottom right corner.Curve D1 intersects curve S1 at point A, and curve S2 at point D.Demand curve D2 has the same slope as curve D1, but is plotted to the right Curve D2 intersects curve S1 at point B, and curve S2 at point C.
-Refer to Figure 14.4.Italians cut back on smoking and cut their demand for Canadian cigarettes in half.Assuming all else remains constant, this would be represented as a movement from
Alt text for Figure 14.4: In figure 14.4, a graph illustrates the quantity of dollars traded against the exchange rate.
Long description for Figure 14.4: The x-axis is labelled, quantity of dollars traded, and the y-axis is labelled, exchange rate, euros against dollars.2 supply curves; S1 and S2, and 2 demand curves; D1 and D2 are plotted.Supply curve S1 is a straight line which slopes up from the bottom left corner to the top right corner.It passes through points A and B.Supply curve S2 is a straight line with the same slope as curve S1, but is plotted to the right.Curve S2 passes through points D and C.Demand curve D1 is a straight line which slopes down from the top left corner to the bottom right corner.Curve D1 intersects curve S1 at point A, and curve S2 at point D.Demand curve D2 has the same slope as curve D1, but is plotted to the right Curve D2 intersects curve S1 at point B, and curve S2 at point C.
-Refer to Figure 14.4.Italians cut back on smoking and cut their demand for Canadian cigarettes in half.Assuming all else remains constant, this would be represented as a movement from
(Multiple Choice)
4.9/5 (39)
The balance of payments can only be zero if Canada has incurred overall balance of payments deficits.
(True/False)
4.9/5 (32)
Expansionary fiscal policy crowds out both domestic investment and net exports.
(True/False)
4.8/5 (42)
If the Bank of Canada does not take into account the additional policy channels available in an open economy, then ________ when conducting contractionary monetary policy.
(Multiple Choice)
4.9/5 (31)
Which of the following is an example of foreign direct investment in China?
(Multiple Choice)
4.9/5 (38)
How might a Canadian federal budget surplus affect the balance of trade? (Assume exchange rates are stated in terms of foreign currency per Canadian dollar.)
(Multiple Choice)
4.9/5 (34)
Filters
- Essay(0)
- Multiple Choice(0)
- Short Answer(0)
- True False(0)
- Matching(0)