Exam 14: Macroeconomics in an Open Economy
Exam 1: Economics: Foundations and Models148 Questions
Exam 2: Trade-Offs, Comparative Advantage, and the Market System314 Questions
Exam 3: Where Prices Come From: The Interaction of Supply and Demand314 Questions
Exam 4: GDP: Measuring Total Production and Income277 Questions
Exam 5: Unemployment and Inflation300 Questions
Exam 6: Economic Growth, The Financial System, and Business Cycles262 Questions
Exam 7: Long-Run Economic Growth: Sources and Policies280 Questions
Exam 8: Aggregate Expenditure and Output in the Short Run315 Questions
Exam 9: Aggregate Demand and Aggregate Supply Analysis246 Questions
Exam 10: Money, Banks, and the Bank of Canada285 Questions
Exam 11: Monetary Policy281 Questions
Exam 12: Fiscal Policy303 Questions
Exam 13: Inflation, Unemployment, and Bank of Canada Policy265 Questions
Exam 14: Macroeconomics in an Open Economy280 Questions
Exam 15: The International Financial System228 Questions
Select questions type
If there is currently a surplus of dollars, which of the following would you expect to see in the foreign exchange market?
(Multiple Choice)
4.8/5  (25)
(25)
Figure 14.2 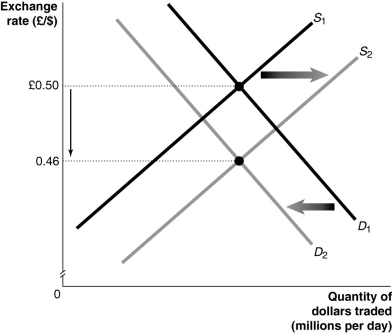 Alt text for Figure 14.2: In figure 14.2, a graph illustrates the quantity of dollars traded against the exchange rate.
Long description for Figure 14.2: The x-axis is labelled, quantity of dollars traded in millions per day, and the y-axis is labelled, exchange rate, British pound against Canadian dollars, with points 0.46 and British pound 0.50 marked.2 straight line supply curves, S1 and S2, slope up from the bottom left corner to the top right corner.Curve S2 is plotted to the right of curve S1.Demand curves D1 and D2 are straight line curves which slope down from the top left corner to the bottom left corner, with curve D2 plotted to the left of curve D1.Curves S1 and S2 intersect demand curves D1 and D2.The intersection point of curves S1 and D1 is connected to its corresponding y-axis value of British pound 0.50 with a dotted line.The intersection point of curves S2 and D2 is connected to its corresponding y-axis value of 0.46 with a dotted line.The intersection point of curves S1 and D1 is connected to its corresponding y-axis value of British pound 0.50 with a dotted line.A down pointing arrow indicates the difference between these values on the y-axis.arrow is shown between the 2 dotted lines.A right pointing arrow indicates the change from curve S1 to curve S2, and a left pointing arrow indicates the change from curve D1 to curve D2.
-Refer to Figure 14.2.Which of the events below would cause the shifts in the supply and demand curves in the market for Canadian dollars against the British pound shown in the graph above?
Alt text for Figure 14.2: In figure 14.2, a graph illustrates the quantity of dollars traded against the exchange rate.
Long description for Figure 14.2: The x-axis is labelled, quantity of dollars traded in millions per day, and the y-axis is labelled, exchange rate, British pound against Canadian dollars, with points 0.46 and British pound 0.50 marked.2 straight line supply curves, S1 and S2, slope up from the bottom left corner to the top right corner.Curve S2 is plotted to the right of curve S1.Demand curves D1 and D2 are straight line curves which slope down from the top left corner to the bottom left corner, with curve D2 plotted to the left of curve D1.Curves S1 and S2 intersect demand curves D1 and D2.The intersection point of curves S1 and D1 is connected to its corresponding y-axis value of British pound 0.50 with a dotted line.The intersection point of curves S2 and D2 is connected to its corresponding y-axis value of 0.46 with a dotted line.The intersection point of curves S1 and D1 is connected to its corresponding y-axis value of British pound 0.50 with a dotted line.A down pointing arrow indicates the difference between these values on the y-axis.arrow is shown between the 2 dotted lines.A right pointing arrow indicates the change from curve S1 to curve S2, and a left pointing arrow indicates the change from curve D1 to curve D2.
-Refer to Figure 14.2.Which of the events below would cause the shifts in the supply and demand curves in the market for Canadian dollars against the British pound shown in the graph above?
(Multiple Choice)
4.7/5 (34)
In an open economy, expansionary monetary policy will cause
(Multiple Choice)
4.7/5 (37)
Assuming Canada is the "domestic" country, if the real exchange rate between Canada and Russia decreases from 28 to 23,
(Multiple Choice)
4.9/5 (32)
If Canada has a net export surplus, which of the following must be true?
(Multiple Choice)
4.9/5 (29)
Based on the following information, what is the balance on the financial account? Exports of goods and services = $5 billion
Imports of goods and services = $3 billion
Net income on investments = -$2 billion
Net transfers = -$2 billion
Increase in foreign holdings of assets in Canada = $4 billion
Increase in Canadian holdings of assets in foreign countries = -$1 billion
(Multiple Choice)
4.8/5 (31)
How does contractionary monetary policy affect net exports in the short run?
(Multiple Choice)
4.9/5 (25)
How is the impact of contractionary monetary policy different in an open economy than in a closed economy?
(Essay)
4.8/5 (32)
Which of the groups below would benefit from a "strong" Canadian dollar?
(Multiple Choice)
4.8/5 (34)
Suppose that domestic investment in Canada is 10.7% of GDP, and Canada's national savings is 13% of GDP.What is Canada's foreign investment as a percentage of GDP?
(Multiple Choice)
4.9/5 (34)
Explain the relationship between net exports and net foreign investment.
(Essay)
4.9/5 (33)
If foreign holdings of Canadian dollars decrease, holding all else constant,
(Multiple Choice)
4.9/5 (40)
The current account deficits incurred by the United States in the 1990s and early 2000s were caused, in the opinion of many economists, by
(Multiple Choice)
4.9/5 (31)
Expansionary monetary policy lowers interest rates and forces a real appreciation of the dollar in international currency markets.
(True/False)
4.8/5 (37)
Japan has a fairly high saving rate and the level of saving in Japan is above domestic investment.Use the saving and investment equation to explain what Japan is doing with this excess of saving above domestic investment.
(Essay)
4.7/5 (42)
Public saving equals taxes minus government spending minus transfer payments.
(True/False)
4.7/5 (42)
Which of the following transactions would be included in Japan's current account?
(Multiple Choice)
4.8/5 (32)
Filters
- Essay(0)
- Multiple Choice(0)
- Short Answer(0)
- True False(0)
- Matching(0)