Exam 14: Macroeconomics in an Open Economy
Exam 1: Economics: Foundations and Models148 Questions
Exam 2: Trade-Offs, Comparative Advantage, and the Market System314 Questions
Exam 3: Where Prices Come From: The Interaction of Supply and Demand314 Questions
Exam 4: GDP: Measuring Total Production and Income277 Questions
Exam 5: Unemployment and Inflation300 Questions
Exam 6: Economic Growth, The Financial System, and Business Cycles262 Questions
Exam 7: Long-Run Economic Growth: Sources and Policies280 Questions
Exam 8: Aggregate Expenditure and Output in the Short Run315 Questions
Exam 9: Aggregate Demand and Aggregate Supply Analysis246 Questions
Exam 10: Money, Banks, and the Bank of Canada285 Questions
Exam 11: Monetary Policy281 Questions
Exam 12: Fiscal Policy303 Questions
Exam 13: Inflation, Unemployment, and Bank of Canada Policy265 Questions
Exam 14: Macroeconomics in an Open Economy280 Questions
Exam 15: The International Financial System228 Questions
Select questions type
Figure 14.1  Alt text for Figure 14.1: In figure 14.1, a graph illustrates the quantity of dollars traded against the exchange rate.
Long description for Figure 14.1: The x-axis is labelled, quantity of dollars traded, and the y-axis is labelled, exchange rate, euros against dollars.2 supply curves; S1 and S2, and two demand curves; D1 and D2 are plotted.Supply curve S1 is a straight line which slopes up from the bottom left corner to the top left corner, and passes through points A and B.Supply curve S2 is a straight line with the same slope as S1, but plotted above.S2 passes through points D and C.Demand curve D1 is a straight line, which slopes down from the top left corner to the bottom right corner.Curve D1 intersects curve S1 at point A, and curve S2 at point D.Demand curve D2 is a straight line with the same slope as D1, but plotted above.Curve D2 intersects curve S1 at point B, and curve S2 at point C.
-Refer to Figure 14.1.The French fall in love with British Columbian wines and triple their purchases of this beverage.Assuming all else remains constant, this would be represented as a movement from
Alt text for Figure 14.1: In figure 14.1, a graph illustrates the quantity of dollars traded against the exchange rate.
Long description for Figure 14.1: The x-axis is labelled, quantity of dollars traded, and the y-axis is labelled, exchange rate, euros against dollars.2 supply curves; S1 and S2, and two demand curves; D1 and D2 are plotted.Supply curve S1 is a straight line which slopes up from the bottom left corner to the top left corner, and passes through points A and B.Supply curve S2 is a straight line with the same slope as S1, but plotted above.S2 passes through points D and C.Demand curve D1 is a straight line, which slopes down from the top left corner to the bottom right corner.Curve D1 intersects curve S1 at point A, and curve S2 at point D.Demand curve D2 is a straight line with the same slope as D1, but plotted above.Curve D2 intersects curve S1 at point B, and curve S2 at point C.
-Refer to Figure 14.1.The French fall in love with British Columbian wines and triple their purchases of this beverage.Assuming all else remains constant, this would be represented as a movement from
(Multiple Choice)
4.8/5  (27)
(27)
An increase in federal government budget deficits that raises Canadian interest rates relative to the rest of the world should
(Multiple Choice)
4.9/5 (39)
Based on the following information, what is the balance of the financial account? Exports of goods and services = $12 billion
Imports of goods and services = $14 billion
Net income on investments = -$4 billion
Net transfers = -$1 billion
Increase in foreign holdings of assets in Canada = $5 billion
Increase in Canadian holdings of assets in foreign countries = -$3 billion
(Multiple Choice)
4.9/5 (32)
Figure 14.1 Alt text for Figure 14.1: In figure 14.1, a graph illustrates the quantity of dollars traded against the exchange rate.
Long description for Figure 14.1: The x-axis is labelled, quantity of dollars traded, and the y-axis is labelled, exchange rate, euros against dollars.2 supply curves; S1 and S2, and two demand curves; D1 and D2 are plotted.Supply curve S1 is a straight line which slopes up from the bottom left corner to the top left corner, and passes through points A and B.Supply curve S2 is a straight line with the same slope as S1, but plotted above.S2 passes through points D and C.Demand curve D1 is a straight line, which slopes down from the top left corner to the bottom right corner.Curve D1 intersects curve S1 at point A, and curve S2 at point D.Demand curve D2 is a straight line with the same slope as D1, but plotted above.Curve D2 intersects curve S1 at point B, and curve S2 at point C.
-Refer to Figure 14.1.The depreciation of the dollar is represented as a movement from
(Multiple Choice)
4.7/5 (46)
You're travelling in Japan and are thinking about buying a new kimono.You've decided you'd be willing to pay $175 for a new kimono, but kimonos in Japan are all priced in yen.If the exchange rate is 89 yen per Canadian dollar, what is the highest price in yen you'd be willing to pay for a kimono? (Assume no taxes or duties are associated with the purchase.)
(Multiple Choice)
4.8/5 (34)
The level of saving in Canada has historically been low relative to the level of domestic investment.Based on this information, we would expect that
(Multiple Choice)
4.8/5 (27)
Net foreign investment minus net foreign portfolio investment is equal to
(Multiple Choice)
4.7/5 (35)
Which of the following will not shift the demand for the euro to the right?
(Multiple Choice)
4.7/5 (33)
All else equal, a depreciation of the British pound relative to currencies such as the euro and the Canadian dollar should ________ British exports and ________ imports to Great Britain.
(Multiple Choice)
4.7/5 (22)
How will an interest rate decrease in Canada affect equilibrium in the foreign exchange market?
(Multiple Choice)
4.8/5 (27)
If the Bank of Canada pursues an expansionary monetary policy, investment in Canada will ________, and net exports will ________.
(Multiple Choice)
4.7/5 (31)
Which of the following will shift the demand for the euro to the right?
(Multiple Choice)
4.8/5 (37)
Figure 14.4 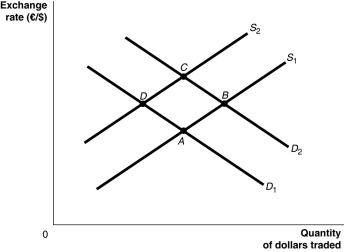 Alt text for Figure 14.4: In figure 14.4, a graph illustrates the quantity of dollars traded against the exchange rate.
Long description for Figure 14.4: The x-axis is labelled, quantity of dollars traded, and the y-axis is labelled, exchange rate, euros against dollars.2 supply curves; S1 and S2, and 2 demand curves; D1 and D2 are plotted.Supply curve S1 is a straight line which slopes up from the bottom left corner to the top right corner.It passes through points A and B.Supply curve S2 is a straight line with the same slope as curve S1, but is plotted to the right.Curve S2 passes through points D and C.Demand curve D1 is a straight line which slopes down from the top left corner to the bottom right corner.Curve D1 intersects curve S1 at point A, and curve S2 at point D.Demand curve D2 has the same slope as curve D1, but is plotted to the right Curve D2 intersects curve S1 at point B, and curve S2 at point C.
-Refer to Figure 14.4.The depreciation of the euro is represented as a movement from
Alt text for Figure 14.4: In figure 14.4, a graph illustrates the quantity of dollars traded against the exchange rate.
Long description for Figure 14.4: The x-axis is labelled, quantity of dollars traded, and the y-axis is labelled, exchange rate, euros against dollars.2 supply curves; S1 and S2, and 2 demand curves; D1 and D2 are plotted.Supply curve S1 is a straight line which slopes up from the bottom left corner to the top right corner.It passes through points A and B.Supply curve S2 is a straight line with the same slope as curve S1, but is plotted to the right.Curve S2 passes through points D and C.Demand curve D1 is a straight line which slopes down from the top left corner to the bottom right corner.Curve D1 intersects curve S1 at point A, and curve S2 at point D.Demand curve D2 has the same slope as curve D1, but is plotted to the right Curve D2 intersects curve S1 at point B, and curve S2 at point C.
-Refer to Figure 14.4.The depreciation of the euro is represented as a movement from
(Multiple Choice)
5.0/5 (43)
A Canadian hospital hires radiology services from India to cut costs.If all else remains equal, this will
(Multiple Choice)
4.9/5 (39)
If the dollar appreciates, how will aggregate demand in Canada be affected?
(Multiple Choice)
4.9/5 (35)
Ceteris paribus, a rise in interest rates in Canada will cause the yen price of the dollar in international exchange markets to ________; that is, the Canadian dollar ________ in value against the yen.
(Multiple Choice)
4.8/5 (32)
Based in the United States, IBM is a global company with about ________ of its sales coming from within the United States.
(Multiple Choice)
4.8/5 (34)
The ability of the United States to run current account deficits
(Multiple Choice)
4.8/5 (32)
Filters
- Essay(0)
- Multiple Choice(0)
- Short Answer(0)
- True False(0)
- Matching(0)