Exam 15: Multiple Regression Analysis and Model Building
Exam 1: The Where,Why,and How of Data Collection167 Questions
Exam 2: Graphs,Charts and Tablesdescribing Your Data139 Questions
Exam 3: Describing Data Using Numerical Measures138 Questions
Exam 4: Introduction to Probability125 Questions
Exam 5: Discrete Probability Distributions161 Questions
Exam 6: Introduction to Continuous Probability Distributions122 Questions
Exam 7: Introduction to Sampling Distributions136 Questions
Exam 8: Estimating Single Population Parameters174 Questions
Exam 9: Introduction to Hypothesis Testing183 Questions
Exam 10: Estimation and Hypothesis Testing for Two Population Parameters121 Questions
Exam 11: Hypothesis Tests and Estimation for Population Variances69 Questions
Exam 12: Analysis of Variance162 Questions
Exam 13: Goodness-Of-Fit Tests and Contingency Analysis105 Questions
Exam 14: Introduction to Linear Regression and Correlation Analysis139 Questions
Exam 15: Multiple Regression Analysis and Model Building152 Questions
Exam 16: Analyzing and Forecasting Time-Series Data133 Questions
Exam 17: Introduction to Nonparametric Statistics103 Questions
Exam 18: Introduction to Quality and Statistical Process Control43 Questions
Select questions type
In curvilinear regression modeling,a composite model is one that contains either the basic terms or the interactive terms but not both.
(True/False)
4.9/5  (32)
(32)
In a multiple regression model,the regression coefficients are calculated such that the quantity,  ,is minimized.
(True/False)
4.8/5 (31)
The following regression output is the result of a multiple regression application in which we are interested in explaining the variation in retail price of personal computers based on three independent variables,CPU speed,RAM,and hard drive capacity.However,some of the regression output has been omitted. 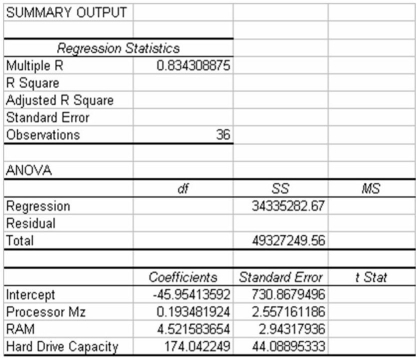 Given this information and your knowledge of multiple regression,what is the value for the standard error of the estimate?
(Essay)
4.8/5 (46)
When an independent variable,that has a positive correlation with the dependent variable,receives a negative slope in a multiple regression,this is probably caused by multicollinearity.
(True/False)
4.8/5 (35)
A study has recently been conducted by a major computer magazine publisher in which the objective was to develop a multiple regression model to explain the variation in price of personal computers.Three quantitative independent variables were used along with one qualitative variable.The qualitative variable was coded 1 if the computer included a monitor,0 otherwise.The following computer printout shows the final output.  Based on this information,it is possible to determine that 4 of the PCs in the data set did not have a monitor included.
(True/False)
4.8/5 (32)
Assume that a time-series plot takes the form of that shown in the following graph: 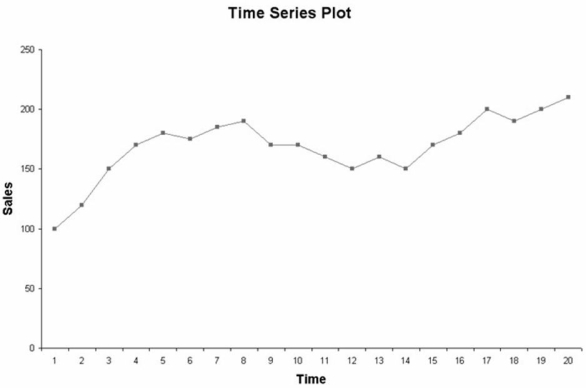 Given this plot,which of the following models would likely give the best fit?
(Multiple Choice)
5.0/5 (35)
Based on the residual plot below,which of the following is correct? 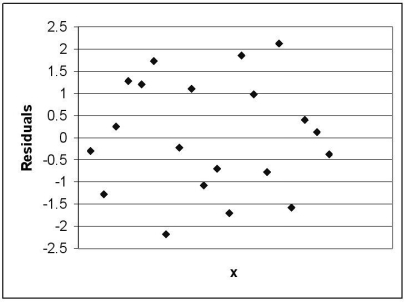 The above residual plot shows:
(Multiple Choice)
4.9/5 (40)
The editors of a national automotive magazine recently studied 30 different automobiles sold in the United States with the intent of seeing whether they could develop a multiple regression model to explain the variation in highway mileage per gallon.A number of different independent variables were collected.The following correlation matrix was developed: 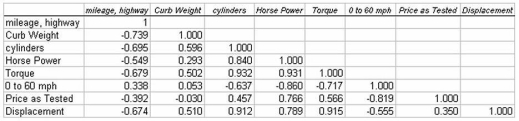 If only one variable were to be brought into the model,which variable should it be if the goal is to explain the highest possible percentage of variation in the dependent variable?
(Multiple Choice)
4.9/5 (28)
In a multiple regression model,R-square can be computed by squaring the highest correlation coefficient between the dependent variable and any independent variable.
(True/False)
4.7/5 (26)
The best subsets method will involve trying fewer different regression models than stepwise regression.
(True/False)
4.8/5 (37)
In a multiple regression model,it is assumed that the errors or residuals are normally distributed.
(True/False)
4.7/5 (34)
A study has recently been conducted by a major computer magazine publisher in which the objective was to develop a multiple regression model to explain the variation in price of personal computers.Three quantitative independent variables were used along with one qualitative variable.The qualitative variable was coded 1 if the computer included a monitor,0 otherwise.The following computer printout shows the final output. 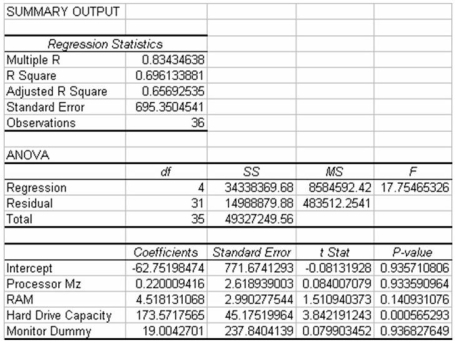 Based on this information,given the other variables in the model,whether or not a monitor is included has a significant impact on the price of the personal computer.
(True/False)
4.8/5 (30)
The following multiple regression output was generated from a study in which two independent variables are included.The first independent variable (X1)is a quantitative variable measured on a continuous scale.The second variable (X2)is qualitative coded 0 if Yes,1 if No. 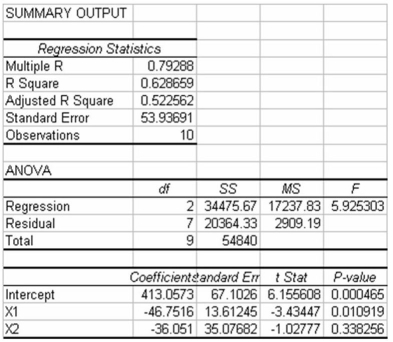 Based on this information,which of the following statements is true?
(Multiple Choice)
4.7/5 (30)
A multiple regression model of the form  = B0 + B1x + B2x2 + ε is called a second-degree polynomial model.
(True/False)
4.7/5 (31)
The editors of a national automotive magazine recently studied 30 different automobiles sold in the United States with the intent of seeing whether they could develop a multiple regression model to explain the variation in highway miles per gallon.A number of different independent variables were collected.The following regression output (with some values missing)was recently presented to the editors by the magazine's analysts:  Based on this output and your understanding of multiple regression analysis,what is the value of the standard error of the estimate for this model?
(Multiple Choice)
4.9/5 (39)
In a multiple regression model,each regression slope coefficient measures the average change in the dependent variable for a one-unit change in the independent variable,all other variables held constant.
(True/False)
4.8/5 (33)
In a multiple regression analysis with three independent variables the null hypothesis for conducting the test of the overall model is:
H0 : β0 = β1 = β2 = β3 = 0.
(True/False)
4.8/5 (39)
Which of the following is an advantage of using stepwise regression compared to just entering all the independent variables at one time?
(Multiple Choice)
4.8/5 (32)
The editors of a national automotive magazine recently studied 30 different automobiles sold in the United States with the intent of seeing whether they could develop a multiple regression model to explain the variation in highway miles per gallon.A number of different independent variables were collected.The following regression output (with some values missing)was recently presented to the editors by the magazine's analysts: 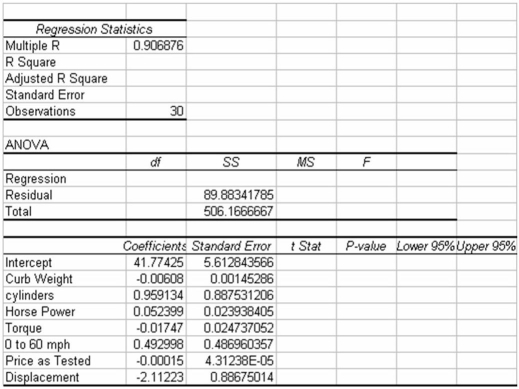 Based on this output and your understanding of multiple regression analysis,how many degrees of freedom are associated with the Residual in the ANOVA table?
(Multiple Choice)
4.8/5 (36)
In regression model: y = β0 + β1x1 + β2
 + ε ,if β2 < 0,then the value of y is expected to increase with x until x reaches a certain point after which the value of y is expected to decrease.
(True/False)
4.8/5 (21)
Filters
- Essay(0)
- Multiple Choice(0)
- Short Answer(0)
- True False(0)
- Matching(0)