Exam 15: Multiple Regression Analysis and Model Building
Exam 1: The Where,Why,and How of Data Collection167 Questions
Exam 2: Graphs,Charts and Tablesdescribing Your Data139 Questions
Exam 3: Describing Data Using Numerical Measures138 Questions
Exam 4: Introduction to Probability125 Questions
Exam 5: Discrete Probability Distributions161 Questions
Exam 6: Introduction to Continuous Probability Distributions122 Questions
Exam 7: Introduction to Sampling Distributions136 Questions
Exam 8: Estimating Single Population Parameters174 Questions
Exam 9: Introduction to Hypothesis Testing183 Questions
Exam 10: Estimation and Hypothesis Testing for Two Population Parameters121 Questions
Exam 11: Hypothesis Tests and Estimation for Population Variances69 Questions
Exam 12: Analysis of Variance162 Questions
Exam 13: Goodness-Of-Fit Tests and Contingency Analysis105 Questions
Exam 14: Introduction to Linear Regression and Correlation Analysis139 Questions
Exam 15: Multiple Regression Analysis and Model Building152 Questions
Exam 16: Analyzing and Forecasting Time-Series Data133 Questions
Exam 17: Introduction to Nonparametric Statistics103 Questions
Exam 18: Introduction to Quality and Statistical Process Control43 Questions
Select questions type
A decision maker is considering including two additional variables into a regression model that has as the dependent variable,Total Sales.The first additional variable is the region of the country (North,South,East,or West)in which the company is located.The second variable is the type of business (Manufacturing,Financial,Information Services,or Other).Given this,how many additional variables will be incorporated into the model?
(Multiple Choice)
4.8/5  (23)
(23)
In a second-order polynomial regression model,the regression coefficient,B2,will be positive if the parabola opens downward and negative when the parabola opens upward.
(True/False)
5.0/5 (32)
Consider the following regression equation:  = 356 + 180x1 - 2.5x2.The x1 variable is a quantitative variable and the x2 variable is a dummy with values 1 and 0.Given this,we can interpret the slope coefficient on variable x2 as follows: Holding x1 constant,if the value of x2 is changed from 0 to 1,the average value of y will decrease by 2.5 units.
(True/False)
4.8/5 (31)
The forward selection method and the backward elimination method will always lead to choosing the same final regression model.
(True/False)
4.8/5 (31)
A decision maker is considering constructing a multiple regression model with two independent variables.The correlation between x1 and y is 0.70,and the correlation between variable x2 and y is 0.50.Based on this,the regression model containing both independent variables will explain 74 percent of the variation in the dependent variable.
(True/False)
4.8/5 (36)
Based on the correlations below:
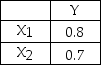 we could say that x1 accounts for 64 percent of the variation in y and x2 accounts for 49 percent of the variation in y.So if both xs are included in a multiple regression model,then the resulting R-square = 1.13.
(True/False)
4.8/5 (33)
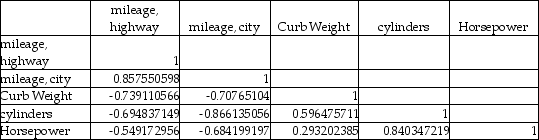
A major car magazine has recently collected data on 30 leading cars in the U.S.market.It is interested in building a multiple regression model to explain the variation in highway miles.The following correlation matrix has been computed from the data collected:
 If only one independent variable (ignoring city mileage)is to be used in explaining the dependent variable in a regression model,the percentage of variation that will be explained will be nearly 74 percent.
(True/False)
4.9/5 (34)
A major car magazine has recently collected data on 30 leading cars in the U.S.market.It is interested in building a multiple regression model to explain the variation in highway miles.The following correlation matrix has been computed from the data collected:
 If the independent variables,curb weight,cylinders,and horsepower are used together in a multiple regression model,there may be a potential problem with multicollinearity since horsepower and cylinders are highly correlated.
(True/False)
4.8/5 (44)
Which of the following is the difference between forward selection and standard stepwise regression?
(Multiple Choice)
4.9/5 (35)
A major car magazine has recently collected data on 30 leading cars in the U.S.market.It is interested in building a multiple regression model to explain the variation in highway miles.The following correlation matrix has been computed from the data collected:
 The analysts also produced the following multiple regression output using curb weight,cylinders,and horsepower as the three independent variables.Note,a number of the output fields are missing,but can be determined from the information provided.
  Based on the information provided,using a 0.05 level of statistical significance,both curb weight and horsepower are statistically significant variables in explaining the variation in the dependent variable when they are included in the model along with cylinders.
(True/False)
5.0/5 (37)
The variance inflation factor (VIF)provides a measure for each independent variable of how much multicollinearity is associated with that particular independent variable.
(True/False)
4.9/5 (39)
The variance inflation factor is an indication of how much multicollinearity there is in the regression model.
(True/False)
4.8/5 (32)
Standard stepwise regression combines attributes of both forward selection and backward elimination.
(True/False)
4.8/5 (32)
In multiple regression analysis,the residual is the absolute difference between the actual value of y and the predicted value of y.
(True/False)
4.8/5 (38)
A multiple regression is shown below for a data set of yachts where the dependent variable is the price of the boat in thousands of dollars. 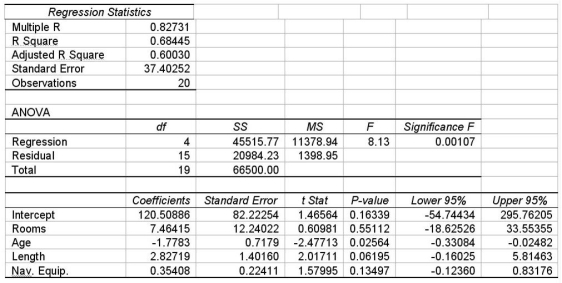 Given this information,what percentage of variation in the dependent variable is explained by the regression model?
(Multiple Choice)
4.9/5 (38)
One of the variables that are being considered for inclusion in a multiple regression model is marital status of the customer.There are four possible responses listed for this variable.Based on this,four dummy variables will need to be created and incorporated into the regression model.
(True/False)
4.9/5 (32)
A major car magazine has recently collected data on 30 leading cars in the U.S.market.It is interested in building a multiple regression model to explain the variation in highway miles.The following correlation matrix has been computed from the data collected:
 The analysts also produced the following multiple regression output using curb weight,cylinders,and horsepower as the three independent variables.Note,a number of the output fields are missing,but can be determined from the information provided.
 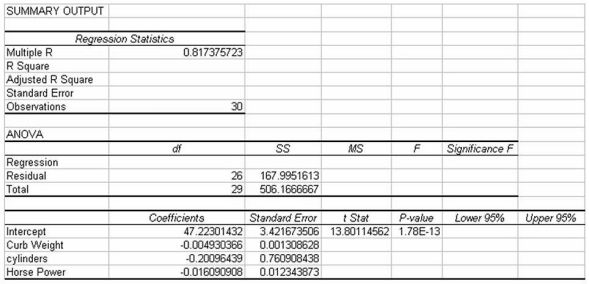 If the analysts are interested in testing whether the overall regression model is statistically significant,the appropriate null and alternative hypotheses are:
H0 : β1 = β2 = β3
Ha : β1 ≠ β2 ≠ β3
If the analysts are interested in testing whether the overall regression model is statistically significant,the appropriate null and alternative hypotheses are:
H0 : β1 = β2 = β3
Ha : β1 ≠ β2 ≠ β3
(True/False)
4.8/5 (40)
Filters
- Essay(0)
- Multiple Choice(0)
- Short Answer(0)
- True False(0)
- Matching(0)