Exam 6: Statistical Methods in Quality Management
Exam 1: Introduction to Quality80 Questions
Exam 2: Foundations of Quality Management80 Questions
Exam 3: Customer Focus80 Questions
Exam 4: Workforce Focus80 Questions
Exam 5: Process Focus79 Questions
Exam 6: Statistical Methods in Quality Management95 Questions
Exam 7: Design for Quality and Product Excellence80 Questions
Exam 8: Measuring and Controlling Quality104 Questions
Exam 9: Process Improvement and Six Sigma80 Questions
Exam 10: The Baldrige Framework for Performance Excellence80 Questions
Exam 11: Strategy and Performance Excellence78 Questions
Exam 12: Measurement and Knowledge Management for Performance Excellence80 Questions
Exam 13: Leadership for Performance Excellence80 Questions
Exam 14: Building and Sustaining Quality and Performance Excellence77 Questions
Select questions type
What is a sampling distribution? State the sampling distributions of  and p for finite populations.
Free
(Essay)
4.7/5  (42)
(42)
Correct Answer: Verified
A sampling distribution is the distribution of a statistic for all possible samples of a fixed size.In quality,the sampling distributions of 
,the sample mean and p,the sample proportion,are of the most interest.
Sampling distribution of 
:
When using simple random sampling,the expected value of 
is the population mean 
.
The standard deviation of 
(often called the standard error of the mean) is given by the formula, 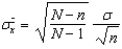
for finite populations.
Sampling distribution of p:
The expected value of p is 
,the population proportion.
The standard deviation of p is, 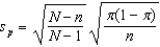 for finite populations.
Statistical methods help managers make sense of data and gain insight about the:
Free
(Multiple Choice)
4.8/5 (29)
Correct Answer:Verified
C
An experiment that evaluates the effect of two temperatures (100 and 200 degrees F) and two reaction times (45 and 95 minutes) on process yield has _____ possible combinations to test.
Free
(Multiple Choice)
4.8/5 (41)
Correct Answer:Verified
B
The collection of all possible outcomes of an experiment is called the _____.
(Multiple Choice)
4.8/5 (29)
The sum of the probabilities over all possible outcomes must be between 0 and 1.
(True/False)
4.7/5 (32)
Explain how the new experiment was conducted to reduce soldering defects in the process.
(Essay)
4.9/5 (40)
The _____ distribution models the time between randomly occurring events.
(Multiple Choice)
4.8/5 (39)
Calculating the average value of 5 sample measurements of a door width is an example of:
(Multiple Choice)
4.8/5 (36)
The _____ measures the degree of asymmetry of observations around the mean.
(Multiple Choice)
4.8/5 (34)
A government report gives a 99% confidence interval for the proportion of welfare recipients who have been receiving welfare benefits for more than 5 years to be 21% 4.5%.Which of the following intervals could not be a 95% confidence interval for the proportion of welfare recipients who have been receiving welfare benefits for more than 5 years?
(Multiple Choice)
4.8/5 (42)
The conditional probability of an event A given that event B is known is given by:
(Multiple Choice)
4.8/5 (43)
One of the most common types of experimental designs in which all combinations of levels of each factor are considered is called a(n) _____ experiment.
(Multiple Choice)
4.8/5 (30)
In ANOVA,by dividing the mean square between groups by the mean square within groups,a(n) _____ statistic is computed.
(Multiple Choice)
4.8/5 (31)
_____ is a test or series of tests that enables the experimenter to compare two or more methods to determine which is better or determine levels of controllable factors to optimize the yield of a process or minimize the variability of a response variable.
(Multiple Choice)
4.7/5 (26)
In general,an experiment with m factors at k levels would have km combinations.
(True/False)
4.8/5 (26)
A _____ is a function that assigns a numerical value to every possible outcome in a sample space.
(Multiple Choice)
4.7/5 (34)
Statistics is a science concerned with the collection,organization,analysis,interpretation,and presentation of data.
(True/False)
4.9/5 (35)
Of 15 ANOVA analysis runs performed on the 13 experimental variables that were measured in the Six Sigma project,why did 8 experimental variables showed no significance?
(Essay)
4.8/5 (37)
What is the conclusion arrived by the team of the Six Sigma project at GE Fanuc manufacturing plant?
(Essay)
4.7/5 (26)
Filters
- Essay(0)
- Multiple Choice(0)
- Short Answer(0)
- True False(0)
- Matching(0)